
As service providers and hyperscalers continue to expand their service footprints, global traffic patterns are shifting, bringing content closer to end users, and providing a better performing and more cost effective connection. This has created an environment for steady IP transit price declines—but the pace of price erosion and absolute price points vary significantly by market.
Here’s an overview of what we’re seeing in the data across global markets, with data and analysis from our IP Networks Research Service platform.
IP transit prices continue to decrease
Across the cities included in the figure below, 100 GigE prices fell 17% compounded annually from Q2 2023 to Q2 2026. In Q2 2026, the lowest 100 GigE prices on offer in the most competitive markets remained steady at $0.03 per Mbps per month. The lowest for 10 GigE also held at $0.07 per Mbps per month.
Weighted Median 100 GigE IP Transit Port Prices & CAGR Price Decline in Key Global Cities
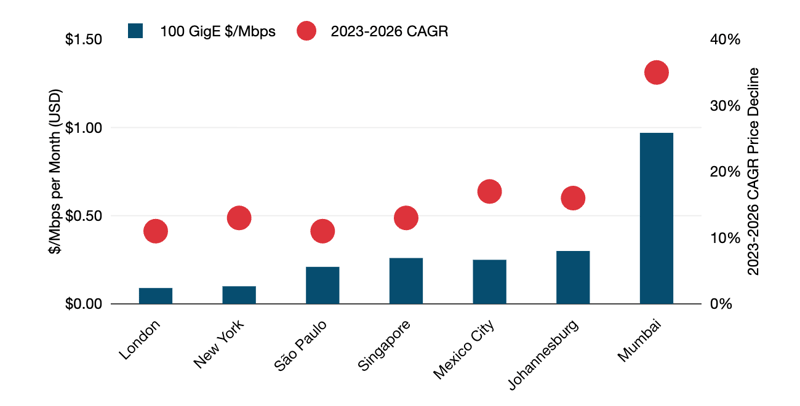
Note: Notes: Each column represents the weighted median monthly price per Mbps for an IP transit port in the listed city. Circles represent the percentage decline of the weighted median price calculated as a three year compound annual growth rate. Prices are in USD and exclude local access and installation fees. 100 Gigabit Ethernet (100 GigE) = 100,000 Mbps.
Why IP transit prices are falling
In global hubs such as London, New York, and Singapore, new transport technologies are the primary driver of cost (and price) reductions. Between 2023 and 2026, 100 GigE port price cuts ranged from 11% to 13% compounded annually. A key trend in these markets is the bottoming out of reported low prices and a growing number of carriers positioning themselves at the lower end of the price range.
In markets in Africa, Latin America, and Asia, the deployment of higher fiber count subsea cable systems is expanding connectivity to regional hubs. These systems have introduced new competition from a mix of regional and global service providers competing to carry international traffic. In addition, growth in local peering and greater localization of content in these regions means improved performance, but also that a smaller percentage of the IP transit price is attributed to subsea costs. Between 2023 and 2026, price cuts in these regions ranged from 11% compounded annually in São Paulo to 35% in Mumbai.
While a majority of sales globally are still at the 100 GigE level, IP transit customers continue to upgrade their networks, and carriers report significant growth of 400 GigE sales driven by massive demand from hyperscalers and companies upgrading their networks in preparation for future AI-related traffic. Key cities in the U.S. and Europe, where current demand is focused, all reported a weighted median price of $0.08 per Mbps. In Q2 2026, price multiples between the MRC for 400 GigE and 100 GigE ports averaged 3.5. Adoption of 400 GigE ports is extremely limited in Asia, Latin America, and Africa, but expected to take off within the next few years. As networks scale to meet increasing demand, price erosion for IP transit remains a certainty in nearly all markets for the foreseeable future.
Get More IP Networks Pricing Data
You’ll find more research like this in our IP Networks Research Service: the most complete source of data and analysis about international internet capacity, traffic, service providers, ASN connectivity, and pricing.