")
We pulled anonymized Google Search Console data from over 400,000 websites and measured how much organic search traffic a typical site actually gets each month.
If I’m being honest: organic traffic benchmarks are a bit silly. The “right” number is unique to every business—your industry, your website, your Domain Rating, your strategy, all change what “normal” looks like. There’s no single average that fits everyone.
But if you need a benchmark—because you, your boss, or your CEO wants to commit to a concrete growth target—the best place to look is the actual monthly organic traffic of websites in a similar spot to yours.
That’s exactly what the data below gives you: real monthly organic traffic, grouped by industry, authority, and size. It’s real, it’s updated every month, and it’s your best starting point for gauging whether your own growth is on track.
Below, we break down median monthly organic traffic by industry, by Domain Rating (DR), and by website size, then look at why the gap between small and large sites is so enormous.
Methodology
This article is updated monthly with fresh data by Agent A.
- This is data from real websites. These benchmarks are built from anonymized, aggregated Google Search Console data from 422,421 real websites. We take each site’s actual organic clicks, aggregate them, and report the figures for the latest complete month.
- “Traffic” here means organic clicks from Google. These are the clicks Google sent to each site for the month—not total visits, not paid, not direct or social. It’s the same number you’d see in your own Search Console performance report.
- We report the median, not the average. A handful of giant sites (think Wikipedia or Amazon) pull averages into the millions and make the typical site look tiny by comparison. The median—the site in the middle of each group—is the better benchmark. (We show the mean alongside it so you can see just how skewed the average is.)
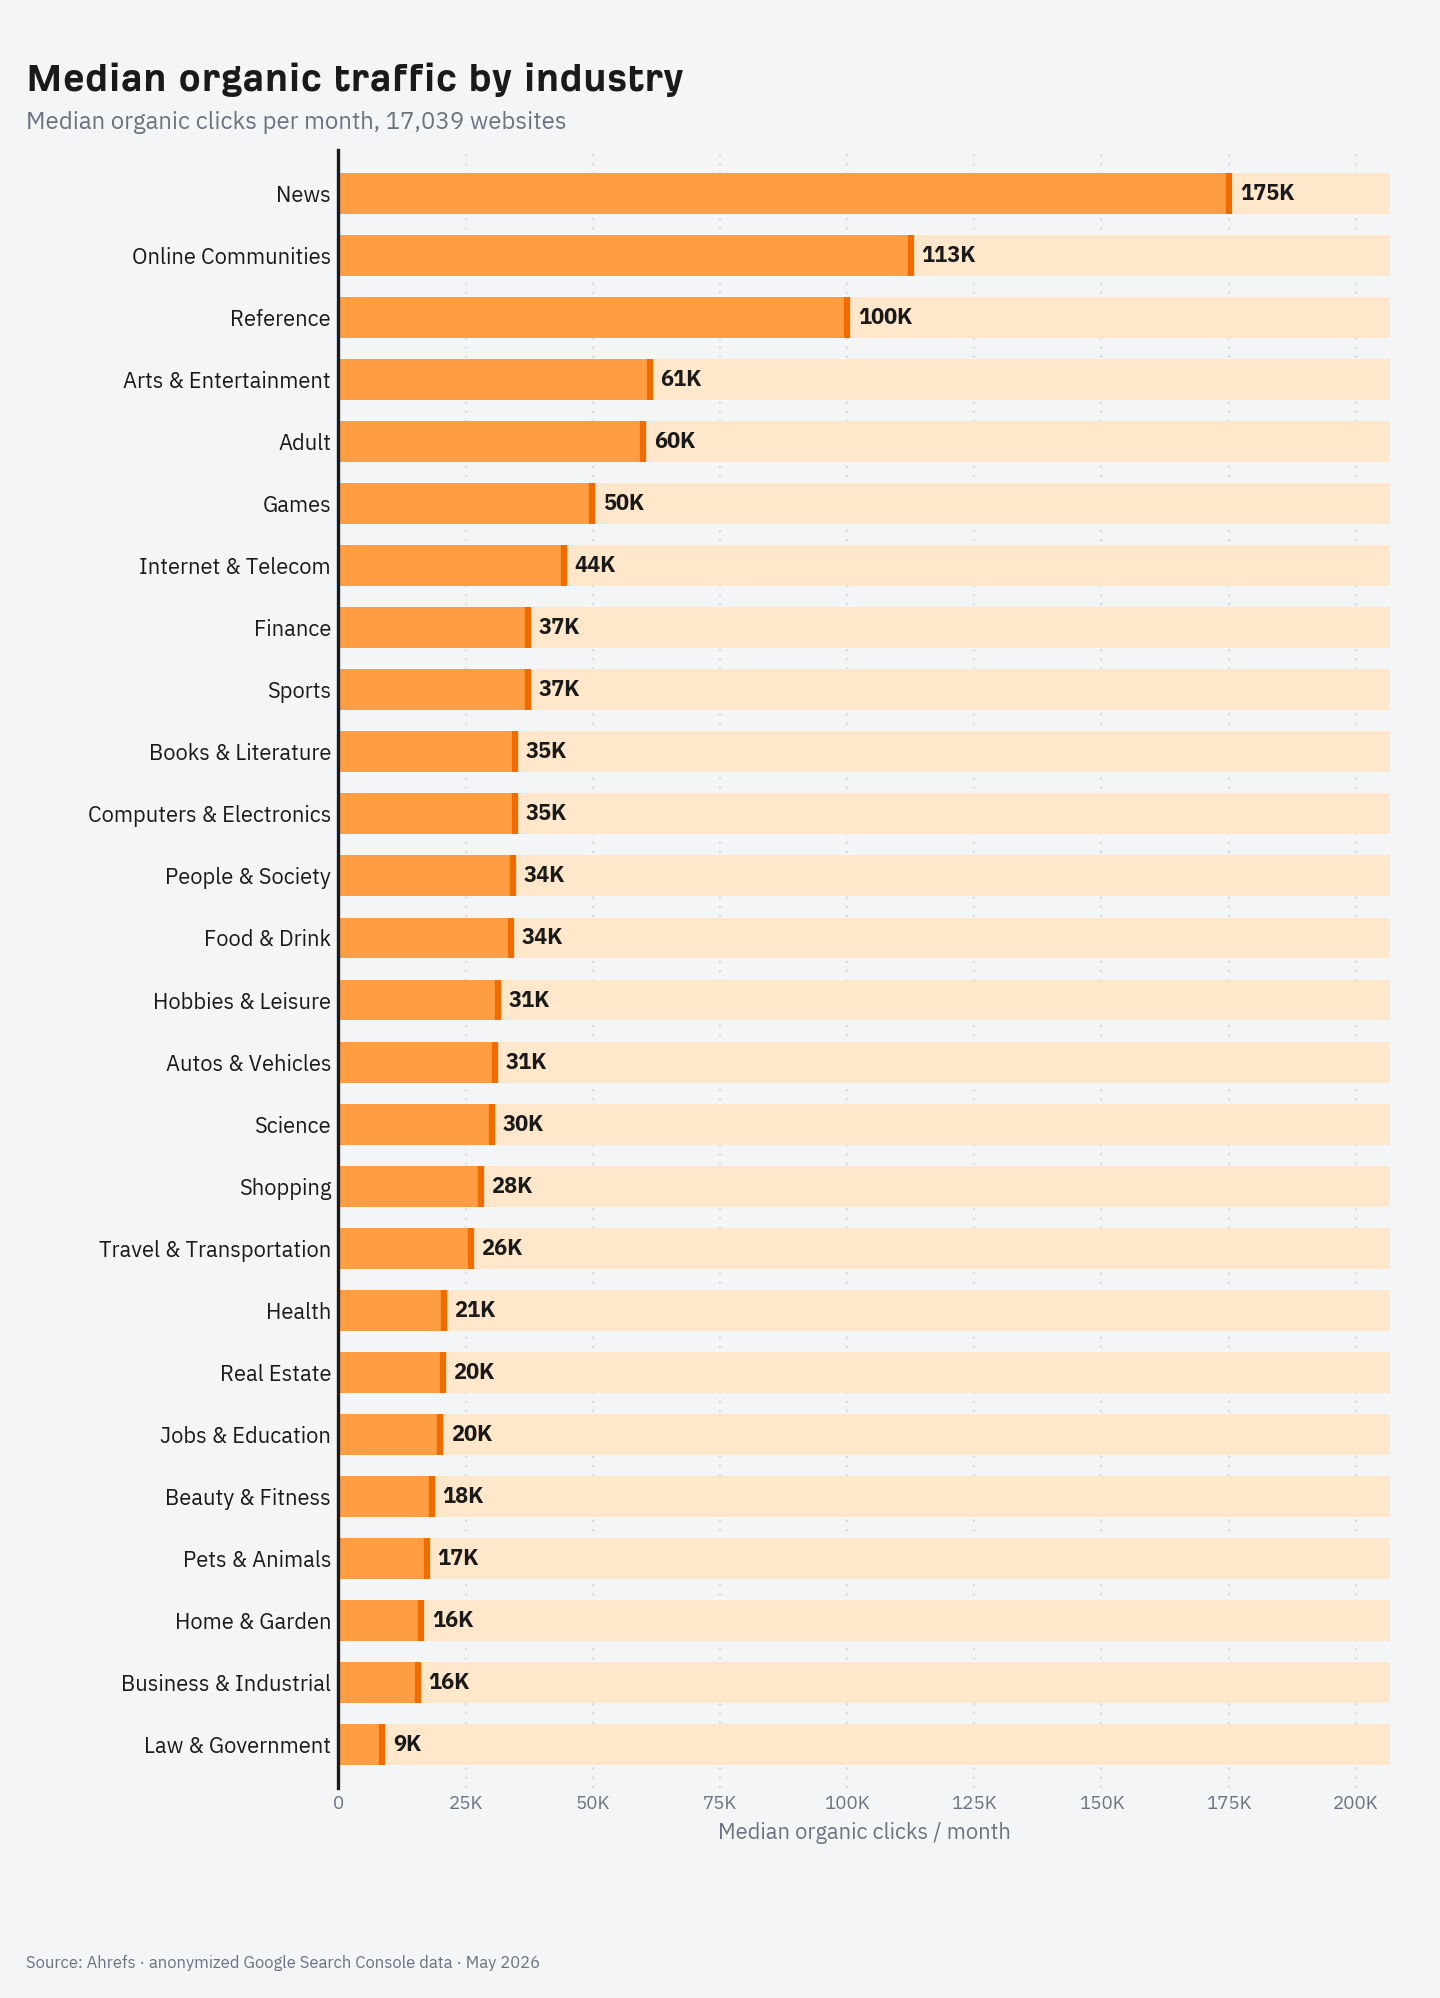
Here’s the median monthly organic traffic for all 26 industry categories, ranked highest to lowest, for May 2026.
| Industry | Median traffic | Mean traffic | Websites in sample |
|---|---|---|---|
| News | 175,115 | 1,207,529 | 515 |
| Online Communities | 112,517 | 658,500 | 21 |
| Reference | 100,007 | 486,647 | 18 |
| Arts & Entertainment | 61,159 | 612,248 | 557 |
| Adult | 59,870 | 1,491,791 | 182 |
| Games | 49,828 | 766,450 | 684 |
| Internet & Telecom | 44,298 | 586,784 | 397 |
| Finance | 37,346 | 351,360 | 1,236 |
| Sports | 37,239 | 533,195 | 717 |
| Books & Literature | 34,736 | 584,439 | 86 |
| Computers & Electronics | 34,679 | 2,555,795 | 535 |
| People & Society | 34,291 | 276,516 | 293 |
| Food & Drink | 33,986 | 359,333 | 717 |
| Hobbies & Leisure | 31,308 | 361,396 | 28 |
| Autos & Vehicles | 30,866 | 248,566 | 808 |
| Science | 30,121 | 674,795 | 142 |
| Shopping | 27,934 | 375,711 | 2,363 |
| Travel & Transportation | 25,990 | 194,639 | 1,314 |
| Health | 20,732 | 132,539 | 1,730 |
| Real Estate | 20,478 | 102,643 | 313 |
| Jobs & Education | 20,029 | 173,885 | 1,356 |
| Beauty & Fitness | 18,362 | 101,390 | 201 |
| Pets & Animals | 17,326 | 68,639 | 266 |
| Home & Garden | 16,325 | 93,440 | 1,419 |
| Business & Industrial | 15,637 | 123,594 | 865 |
| Law & Government | 8,607 | 58,452 | 276 |
A few things stand out:
- News leads the table at 175,115 median monthly clicks. Big-traffic categories like news, reference, and entertainment are dominated by large publishers chasing high-volume informational queries—so even the typical site in these niches pulls serious traffic.
- Law & Government sits at the bottom at 8,607. The lower-traffic categories tend to be local, commercial, or service-driven, where search demand is smaller and more geographically split—fewer total searches to win.
- Watch the gap between median and mean. In almost every category the mean is several times the median, and in some (Computers & Electronics, Adult) it’s more than 40x higher. That gap is a handful of giant sites pulling the average up. It’s exactly why you should benchmark against the median—the average describes an outlier, not you.
- Industry matters less than you’d think. The spread across industries is real, but it’s dwarfed by the spread across authority and size (next two sections). A high-DR site in a “low-traffic” niche will out-traffic a tiny site in a “high-traffic” one, every time.
Authority is the single biggest predictor of traffic, and it isn’t close. The stronger your site (measured here by Domain Rating), the more organic traffic it pulls—and the relationship is exponential, not linear.
Across 422,421 websites, median monthly traffic climbs from just 11 clicks at the bottom of the DR scale to 126,364 at the top. That’s not a percentage difference, it’s a four-orders-of-magnitude difference. Every single DR tier earns more median traffic than the one below it, and each jump gets bigger as you climb.
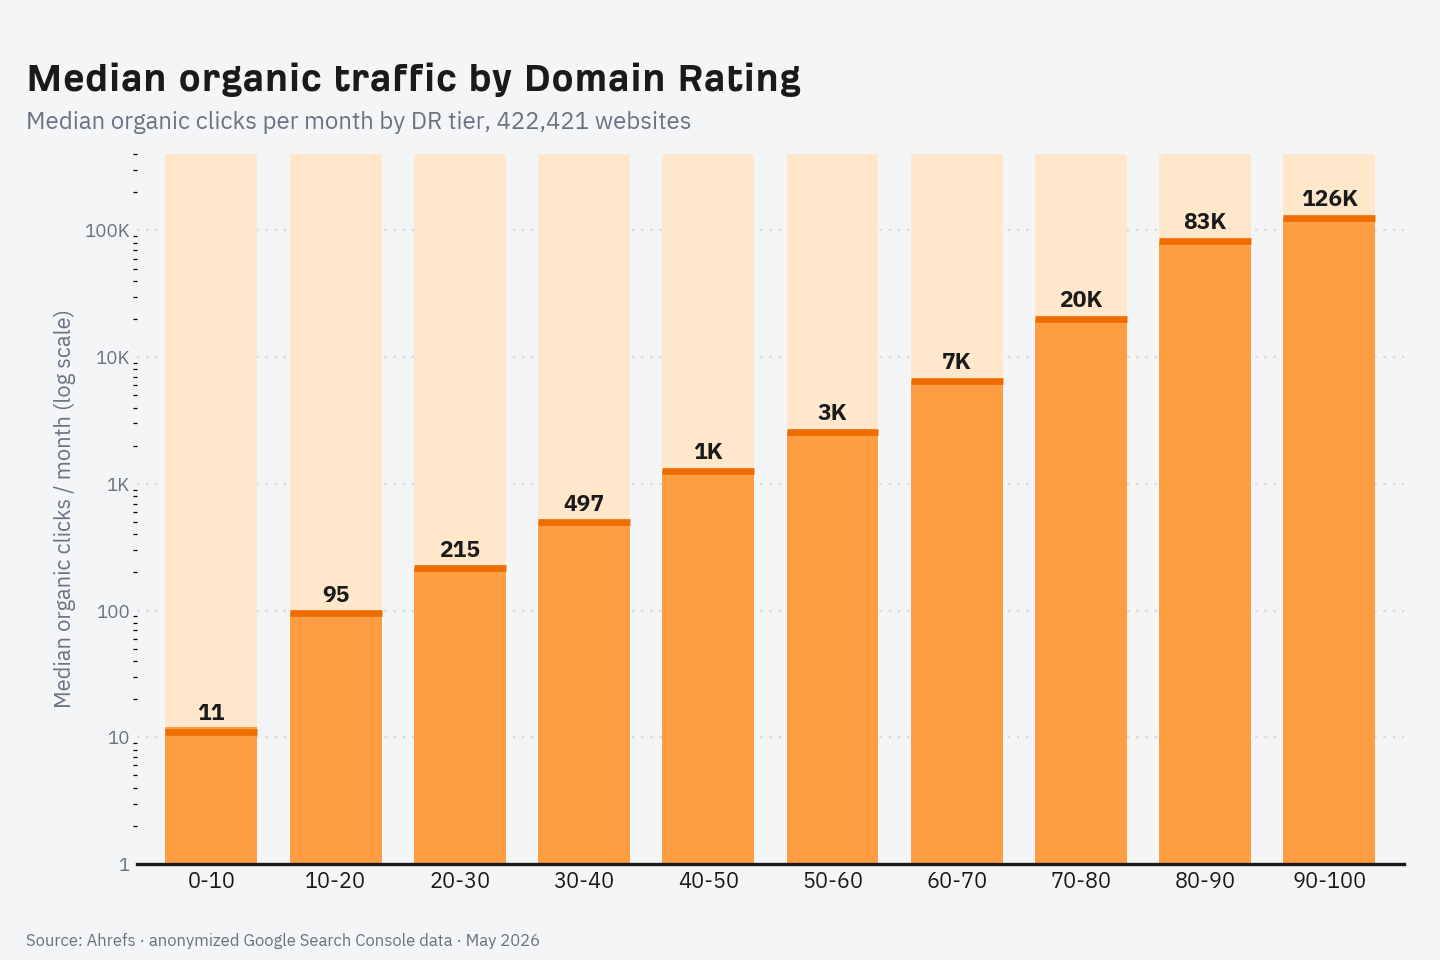
| Domain Rating | Median traffic | Mean traffic | Websites in sample |
|---|---|---|---|
| 0-10 | 11 | 378 | 217,565 |
| 10-20 | 95 | 1,501 | 59,960 |
| 20-30 | 215 | 3,541 | 51,139 |
| 30-40 | 497 | 7,473 | 38,447 |
| 40-50 | 1,264 | 28,181 | 21,499 |
| 50-60 | 2,567 | 48,933 | 15,575 |
| 60-70 | 6,527 | 120,217 | 8,344 |
| 70-80 | 19,980 | 279,757 | 7,858 |
| 80-90 | 82,743 | 1,249,038 | 1,614 |
| 90-100 | 126,364 | 8,401,539 | 420 |
To be clear about cause and effect: more backlinks don’t directly summon traffic. What’s happening is that the things that earn a high DR—lots of quality content, strong links, brand recognition—are the same things that earn rankings and clicks. DR is a proxy for the authority that wins traffic, not a dial you turn to get it.
The takeaway for newer sites: if you’re under DR 30 and getting a few hundred organic clicks a month, you’re not failing—you’re exactly where the data says you should be. Traffic compounds as authority builds, and the steepest gains come later, not sooner.
Bigger sites earn more traffic—and like DR, the relationship is exponential. More indexed pages means more keywords ranked, more queries captured, and more total clicks.
Across 324,522 websites, median monthly traffic rises from 18 clicks for the smallest sites (under 10 pages) to 244,772 for the largest (5,000+ pages). More pages is more surface area to rank, and at scale that surface area compounds.
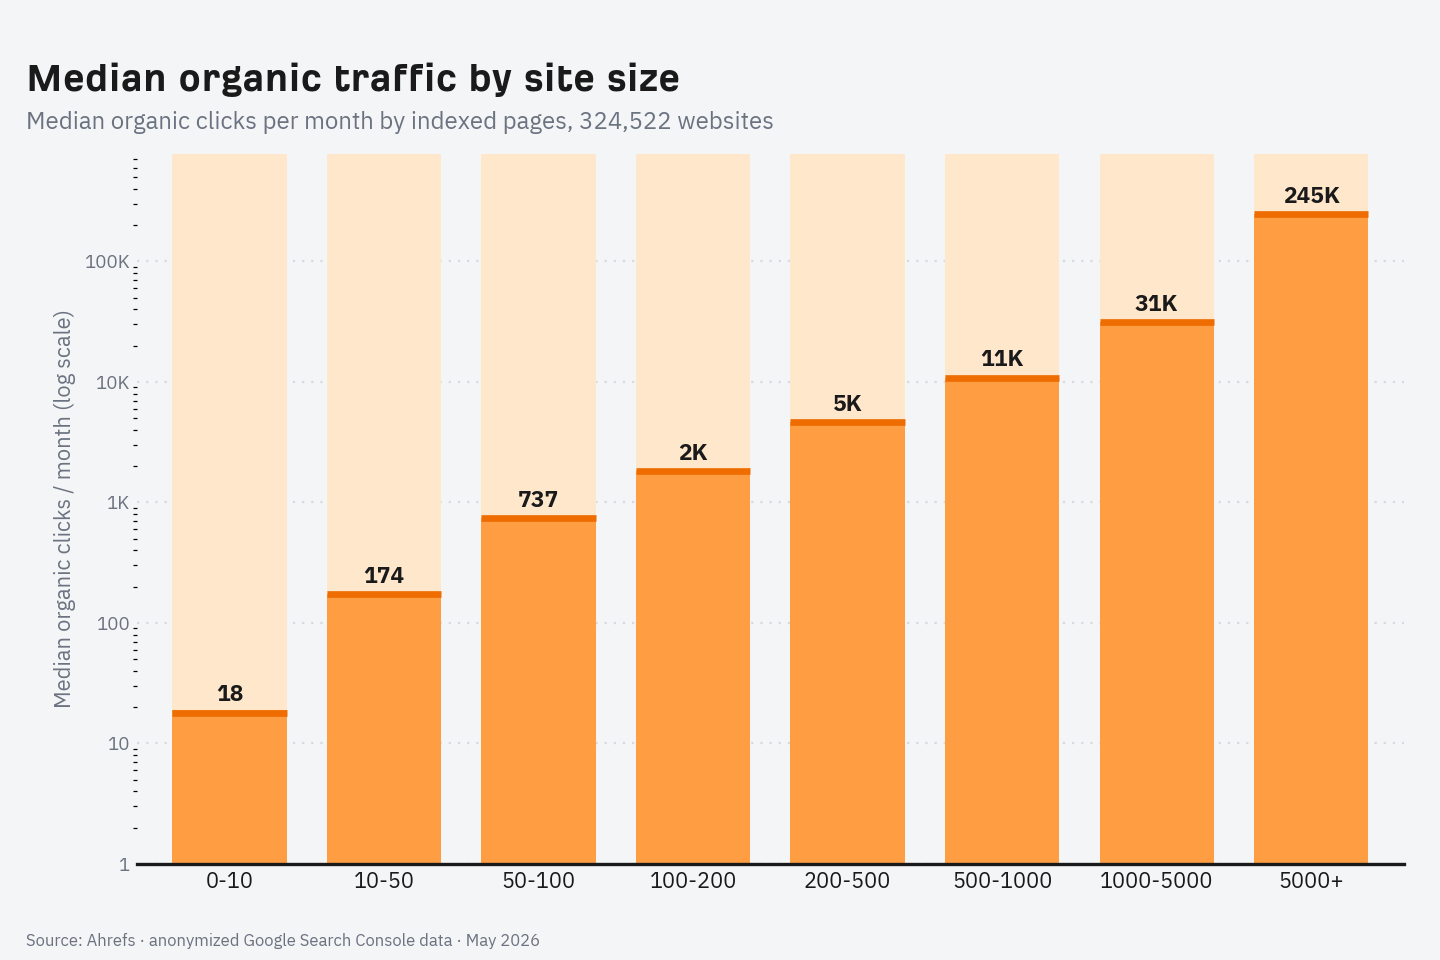
| Indexed pages | Median traffic | Mean traffic | Websites in sample |
|---|---|---|---|
| 0-10 | 18 | 587 | 135,931 |
| 10-50 | 174 | 2,092 | 98,839 |
| 50-100 | 737 | 4,269 | 29,701 |
| 100-200 | 1,813 | 16,767 | 21,192 |
| 200-500 | 4,625 | 27,280 | 17,968 |
| 500-1000 | 10,840 | 48,370 | 8,217 |
| 1000-5000 | 31,318 | 199,881 | 8,910 |
| 5000+ | 244,772 | 1,941,966 | 3,764 |
But remember: more pages only helps if they’re pages worth ranking. A site that publishes 5,000 thin, near-duplicate pages won’t see this growth—the traffic comes from quality content at scale, not page count for its own sake. Size correlates with traffic because the sites that grow large usually grew by publishing things people search for.
The single clearest finding in this data is the enormous gap between the typical small site and the typical large one. Here’s why it’s so wide:
- Organic traffic follows a power law. A small number of sites capture the overwhelming majority of search clicks, while the long tail earns very little each. That’s why the median is so far below the mean in every table—the average is dragged up by a few giants, but the typical site lives down in the long tail.
- Authority compounds. Stronger sites rank for more keywords, and they rank higher, where the clicks are. A small advantage in authority turns into a large advantage in traffic, which earns more links and content, which widens the gap further. The rich get richer.
- Branded and navigational search favors the known. Big sites earn a large share of their traffic from people searching for them by name. A new site has no brand demand yet, so it’s competing purely on unbranded queries—the most contested traffic there is.
What this means for your benchmark
Don’t compare your traffic to a big publisher’s, or to last quarter’s industry “average.” Find your row by authority and size in the tables above—that’s your realistic benchmark. Then track your own trend month over month: steady growth against your own baseline matters far more than hitting some global average.
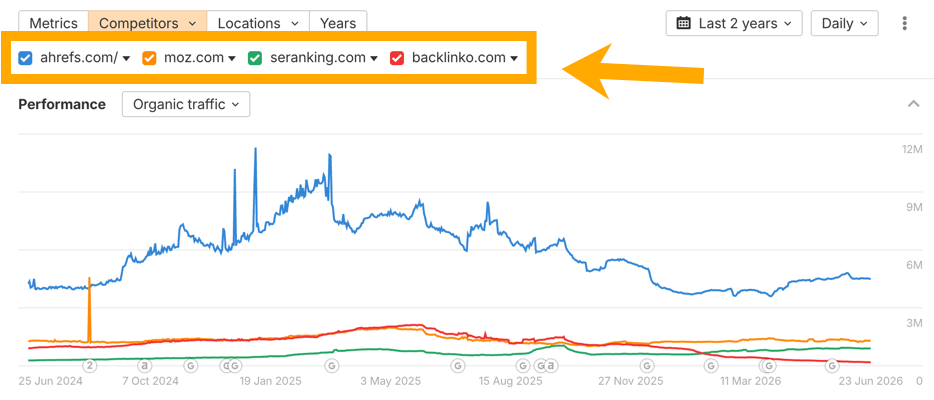
To quickly see how your estimated organic traffic compares to your competitors, add their websites to the Competitors chart in Site Explorer:
If you’re below the benchmark for your authority and size, here are the levers that actually move organic traffic:
- Target keywords you can realistically rank for. Use Keywords Explorer to find terms with real search volume and a difficulty that matches your current authority. Winning easier keywords now builds the authority to win harder ones later.
- Build topical authority, not just pages. Cover a topic thoroughly rather than publishing scattered one-offs. Depth in a niche helps you rank for the whole cluster, not just one term.
- Earn links to your best pages. Backlinks remain a core driver of rankings and the authority that compounds into traffic. Focus them on the pages you most want to rank.
- Refresh and consolidate decaying content. Traffic leaks as content ages and SERPs change. Updating or merging older pages often recovers more traffic, faster, than publishing something new.
- Capture demand AI Overviews don’t. Commercial and navigational queries are far less likely to trigger an AI Overview—and they convert better anyway. Lean into the searches that still send clicks.
One honest caveat: traffic growth is slow, especially early. The DR and size curves above are exponential for a reason—the biggest gains come after you’ve built a base, not in month one. Consistency beats intensity here.
So, what’s an average amount of organic traffic? The honest answer is that “average” is the wrong question—the spread is far too wide for one number to mean anything. A typical sub-DR-30 site earns a few hundred clicks a month; a typical DR 90+ site earns over a hundred thousand. Both are “normal.”
Use the tables above to find your realistic benchmark by authority and size, then judge yourself against your own trend. And remember the bigger shift: as AI Overviews and answer engines reshape search, the clicks are getting harder to win at the bottom of the curve. Building authority—and getting cited inside the AI answers themselves—is how you climb it.

