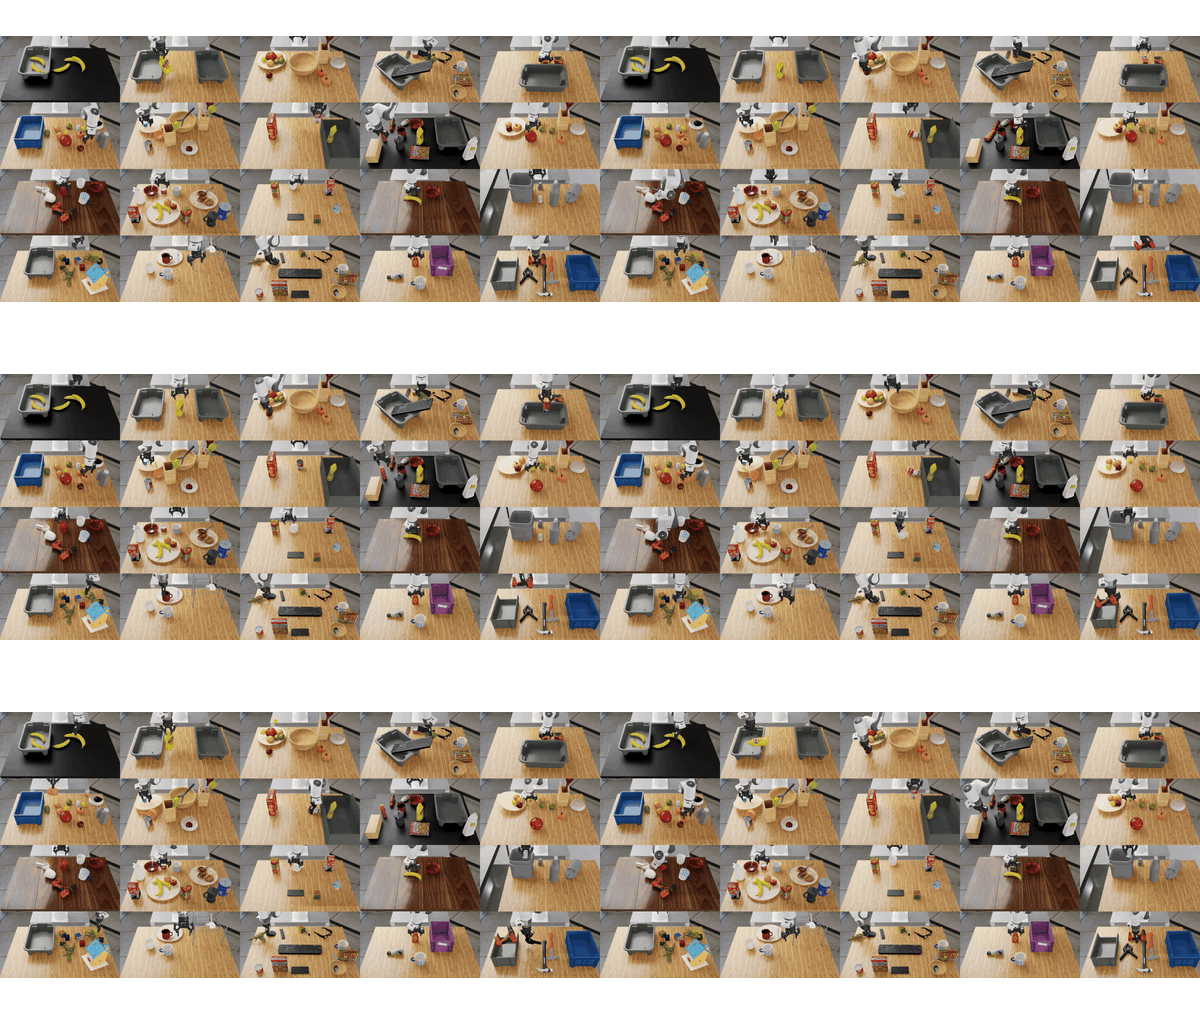
RoboLab is NVIDIA’s simulation benchmarking platform. | Source: NVIDIA
Robotics foundation models have made remarkable progress, according to NVIDIA. Today’s best systems can follow natural language instructions to pick, place, sort, and manipulate a wide variety of objects.
But as these models grow more capable, evaluating them rigorously has become one of the field’s hardest unsolved problems. In this blog post, we introduce the key problems and our method for addressing them.
Why current benchmarks fall short
Real-world testing is expensive, slow, and difficult to reproduce. For a robot’s performance in the real world to be evaluated thoroughly, we need a reasonable proxy. Simulation is the natural place to run large-scale robot evaluations. Yet most existing benchmarks share a few critical issues.
Visual domain overlap in training and evaluation
First, the data and environments used in policy training and evaluation are almost always drawn from the same visual source. When a model is fine-tuned on simulated data and evaluated in that same simulated environment, strong performance reveals only that the model memorized the setup, not that it can generalize. This remains a critical issue in robot evaluations, as the visual quality of simulation hasn’t achieved parity with real-world image observations.
Real2sim approaches address this issue by reconstructing photorealistic environments from real-world images using techniques such as inpainting or Gaussian splatting, but per-scene setup can exceed an hour, making large-scale testing impractical.

Figure 1. Existing sim benchmarks suffer from visual and task-domain overlap, low realism, and high overhead for scene and task generation. Traditional procedural scene generation often suffers from low rendering quality, creating large sim2real visual gaps. 3D reconstructed (3DR) environments bring more realism into simulated environments, but often at the cost of human effort used to generate each scene. | Source: NVIDIA
NVIDIA cites benchmark saturation
Second, generating tasks is a tedious endeavor. Most benchmarks have a fixed task set that is rarely updated. This quickly leads to performance saturation: Models quickly max out scores on static task sets, making it impossible to distinguish which model is genuinely more capable. When every system reports over 90% success on the same benchmark, the numbers become less meaningful.
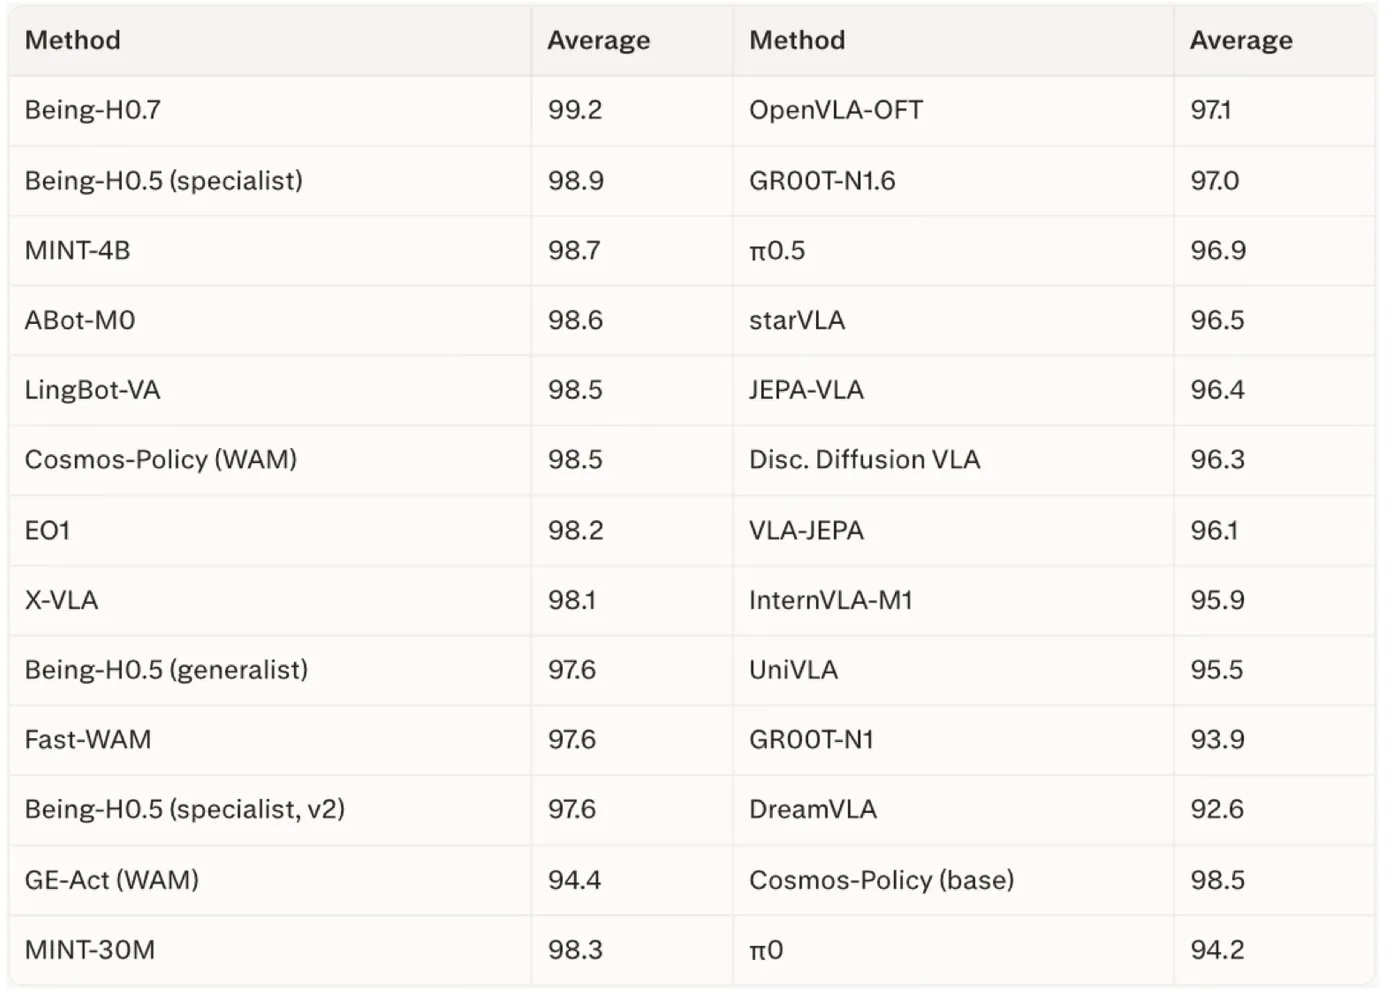
Figure 2. Almost every model paper reports results on this benchmark, but saturation makes it difficult to extract meaningful conclusions about model performance. | Source: NVIDIA
Diagnostic gap
There’s also a deeper diagnostic gap. A binary success/failure score doesn’t explain why a robot failed.
Was it confused by the object’s color? Instruction phrasing? A shifted camera? Did it perform the task efficiently according to the specific language instruction?
Without answers to these questions, researchers have little to act on.

Figure 3. An example evaluation episode for the task “Put the orange measuring cup and the blue measuring cup outside of the plate” with Policy pi0.5. | Source: NVIDIA
Statistical trustworthiness
Every physics engine and policy is subject to some stochasticity. A single success rate on N rollouts tells you almost nothing about how confident you should be in a policy’s true performance. If a policy succeeds nine out of 10 times, is it a “90% success” policy, or could it just as easily be an 80% or 95% policy that got lucky on a small sample? To investigate this, we look at the Clopper-Pearson method.
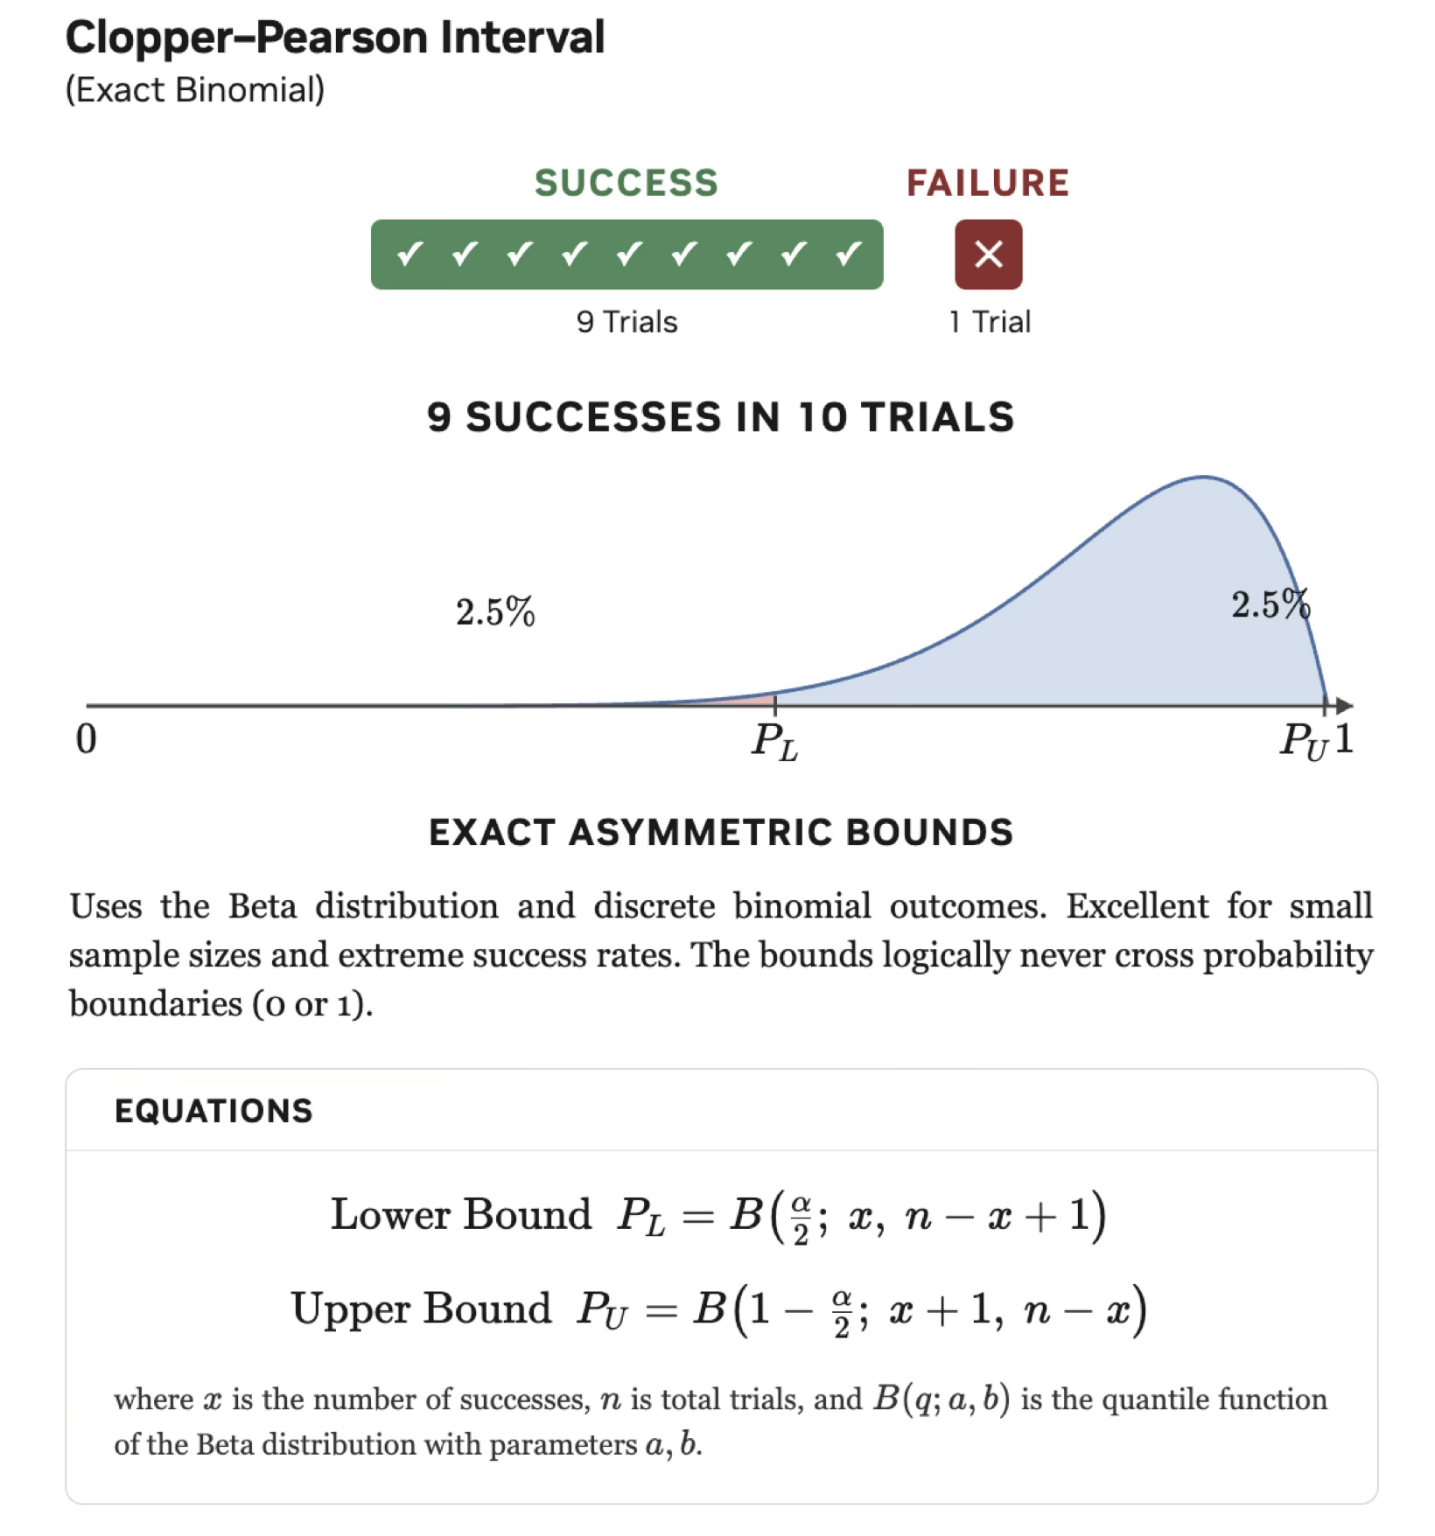
Figure 4. Clopper-Pearson Interval is a method for bounding a binomial success rate. | Source: NVIDIA
The Clopper-Pearson method is an “exact” method for constructing a binomial confidence interval around the success rate, computed directly from the binomial distribution.
Let’s look at the following example: For an observed 90% success rate with just 70 rollouts, a 95% Clopper-Pearson confidence interval spans a full 15.4 percentage points (80.5% to 95.9% success rate). With 1,030 rollouts, this error tightens to a ±2 percentage-point band (88.0% to 91.8% success rate).
Most published benchmarks do not run a sufficient number of rollouts to achieve statistical significance when comparing the performance of two policies.
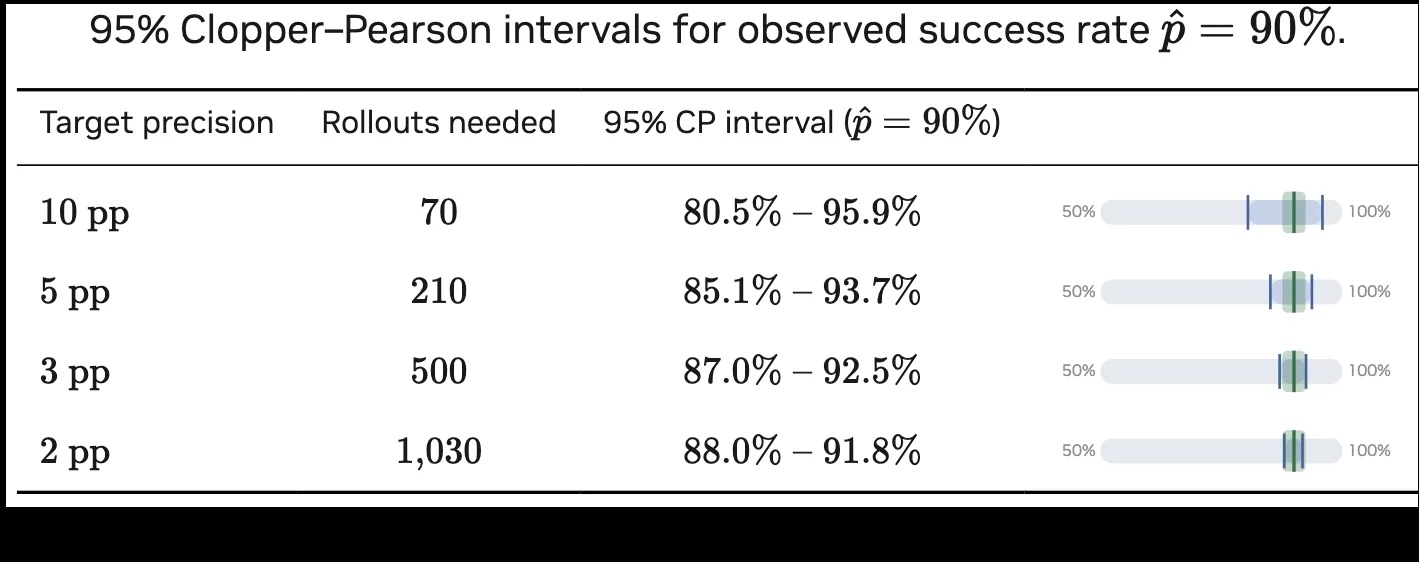
Figure 5. A 95% Clopper-Pearson interval for a success rate of 90%, with blue dashes illustrating the CP interval around 90%. Narrowing the confidence interval from 10 to 2 percentage points requires roughly 15x more rollouts (70 to 1,030). | Source: NVIDIA
NVIDIA introduces RoboLab
NVIDIA has built a simulation benchmarking platform called RoboLab to address these issues. RoboLab is built around three principles:
- Enable robot-agnostic evaluations of the tasks while providing meaningful metrics
- Enable rapid generation of new tasks to avoid benchmark saturation, with support for agentic AI workflows
- Provide a full suite of analysis tools that paint a full picture of how well a policy is doing, when it fails, and why it fails.
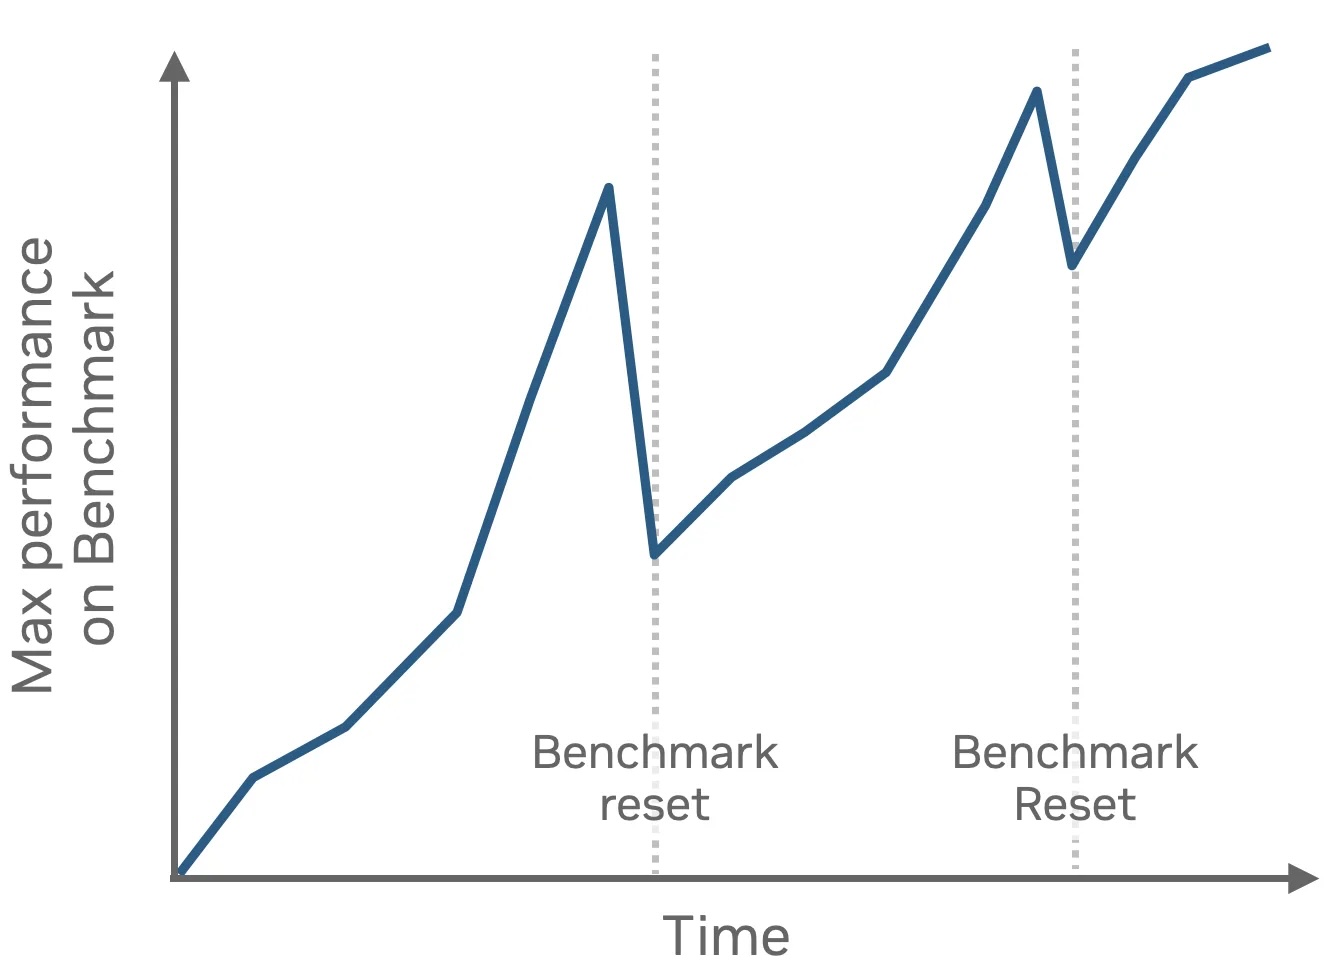
Figure 6. Benchmarks need to adapt to new capabilities as the field evolves. Once the existing benchmark performance saturates, it’s time to adapt and expand the benchmark. | Source: NVIDIA
Robot benchmarking in the age of agentic AI
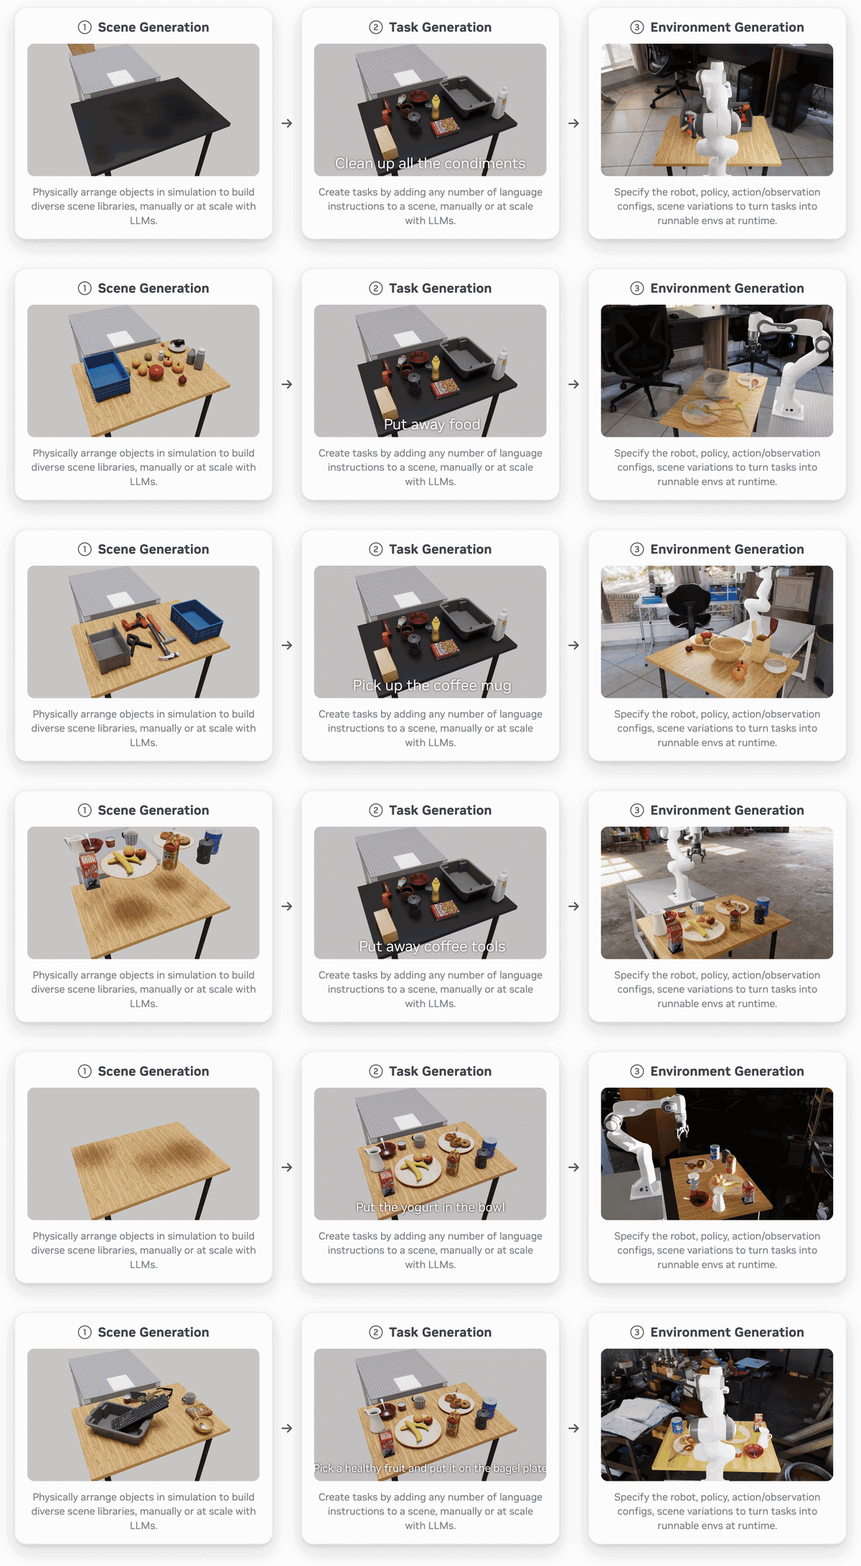
Figure 7. RoboLab’s 3-step scene, task, and environment generation process. | Source: NVIDIA
RoboLab mirrors a real-world setup procedure: place objects, add a language instruction, and run a policy. Given a library of objects, users can simply place the objects in the scene and specify a language instruction — or three! — for the task, with the whole process taking only minutes.
RoboLab also comes with agent skills that a coding agent can use to generate novel tasks directly in a user’s workflow. This efficiency also future-proofs the benchmark: New tasks can be added and outdated ones retired as generalist models improve.
Bring your own robot
Building a generalist robot policy requires solving a long tail of specific tasks, and no single team has abundant data across every embodiment. A lab might have thousands of hours on a Franka arm but almost none on a humanoid, or vice versa. A benchmark tied to one specific robot forces every user into that same data gap, regardless of what they’re actually trying to build or test.
RoboLab tasks are robot- and policy-agnostic, meaning the same set of tasks can be evaluated regardless of robot embodiment or policy architecture. Users are free to make their own design choices; RoboLab simply compiles the same scenes and tasks against whichever robot they bring.
This also makes sense as the number of robot embodiment choices increases in the future; it matters less which robot was used for data generation and training, only that it solved the task.
Capability-specific tasks
A useful benchmark needs to isolate distinct capabilities, not just measure whether a robot completes a task. We have observed that general-purpose manipulation draws on at least three separate competencies:
- Visual competency tests whether a policy can recognize and act on perceptual attributes like color, size, and semantic category, such as distinguishing the small red cup from other objects on the table.
- Procedural competency evaluates action-oriented reasoning: stacking objects, reorienting them, or inferring how to interact with a tool.
- Relational competency probes spatial and linguistic logic, including conjunctions (“pick the orange and the lime”), counting, and relative positions like left of or inside.
By designing tasks that each target one or more specific capabilities, we can ensure broad coverage across the full space of skills a general-purpose policy needs. In RoboLab-120, our initial benchmark of 120 human-curated tabletop pick-and-place tasks, each task is tagged with the multiple capabilities it requires, so the benchmark’s coverage across competencies remains explicit and balanced, and adjusted as new tasks are added.
| Competency | What It Tests | Example Task |
|---|---|---|
| Visual | Color, size, semantic recognition | “Put the small red cup in the bin” |
| Procedural | Stacking, reorientation, affordances | “Put all the mugs right-side-up and stack the red ones on the shelf” |
| Relational | Spatial logic, counting, conjunctions | “Pick the orange or the lime and put it in the bowl” |
Table 1. Competency is the ability for the policy to perform tasks in a capability domain. NVIDIA illustrate some examples of competency and skills that it designs tasks for in its benchmark suite.
Evaluating robot policies
What metrics demonstrate that a robot policy is good?
Success rate alone tells you almost nothing about how a robot performed a task, only whether it crossed the finish line. A policy that grasps the correct object but drops it early can register as a failure, while one that succeeds only after jerky, meandering, or slow motion can register as a success. Neither case is captured using binary success.
To address this, RoboLab uses three additional evaluation tools that together paint a more complete picture of policy behavior:
- Graded task scores: Partial credit is given for completing subtasks within a multi-step instruction, so a robot that grasps the right object but misses the drop target isn’t scored the same as one that does nothing at all.
- Trajectory quality: Measuring motion efficiency via path length and SPARC — spectral arc-length — a human-aligned metric that captures smoothness through the Fourier spectrum of velocity. Shorter, smoother motions are preferred.
- Speed of execution: Measures end effector velocity, another human-aligned metric that captures the human’s perception that faster motion is preferred.
NVIDIA identifies when robot policies fail
Knowing how a task went wrong is just as important as knowing that it did. Beyond the usual performance metrics, RoboLab digs deeper into why a policy succeeds or fails and exactly where in the process things break down.
Failure event logging automatically tracks wrong-object grasps, dropped objects, and gripper collisions, pinpointing precisely where task execution derails.
Let’s observe this task: “Put all plastic bottles away in the bin” task. The policy picked up all the plastic bottles and placed it inside the bin. However, it also placed an additional orange in the bin.
One could observe that, technically, the task was successfully achieved! A task can technically be completed according to specification, yet the robot may still grasp the wrong object along the way before recovering.

Figure 8. Three separate failure events happened during policy execution in a successful rollout of ‘Put all plastic bottles away in the bin.’ | Source: NVIDIA
To inspect these events, RoboLab includes a built-in dashboard that surfaces events as they happen during an episode, so users can jump straight to the frame where a failure occurred. This turns diagnosis from a manual, after-the-fact guessing game into something closer to a debugger for robot behavior.
Instead of asking, “Did it work?” the user can ask, “Where exactly did it stop working, and what was the context that led to that event?”
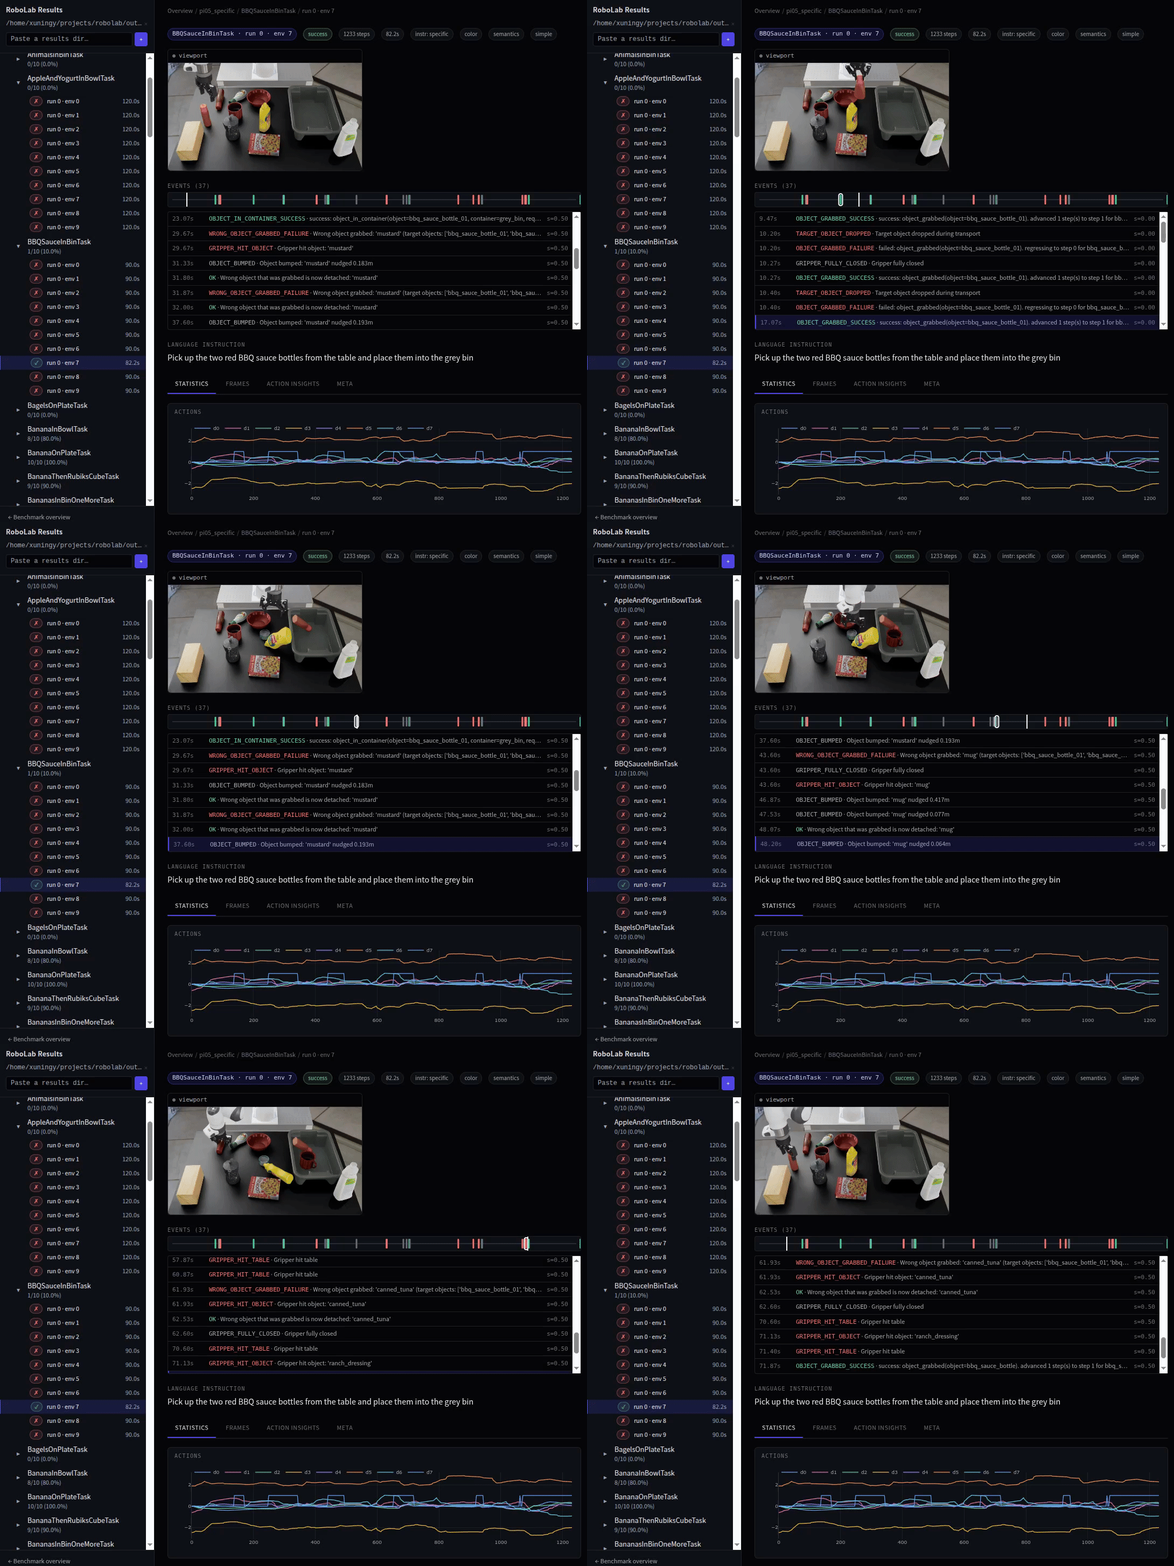
Figure 9. RoboLab includes a built-in dashboard for viewing events during episodes. This allows users to quickly see when the failures happen, and their context. | Source: NVIDIA
How robust is your robot policy against increasing complexity?
Real-world deployment rarely offers the clean, controlled conditions of a benchmark. Instructions come phrased in countless ways, scenes are often cluttered rather than sparse, and tasks can stretch across many steps rather than just one or two.
To understand whether a policy is truly robust, we must analyze performance against increasing complexity in language, scene, and task horizon.
Language complexity
A robot that only understands precisely worded commands is of limited use outside the lab, since people naturally phrase instructions in varied and imprecise ways. Testing against multiple language instructions reveals how much a policy depends on exact phrasing versus genuine task understanding.
RoboLab enables users to specify multiple language instructions in their task specification and choose which variant to use at runtime. In its initial benchmark, NVIDIA provided three variants: vague, default, and specific.
The company found that vague instructions consistently lead to failures, indicating that current models remain brittle to phrasing. It also learned that having too many details in the instructions can sometimes also lead to degraded performance.
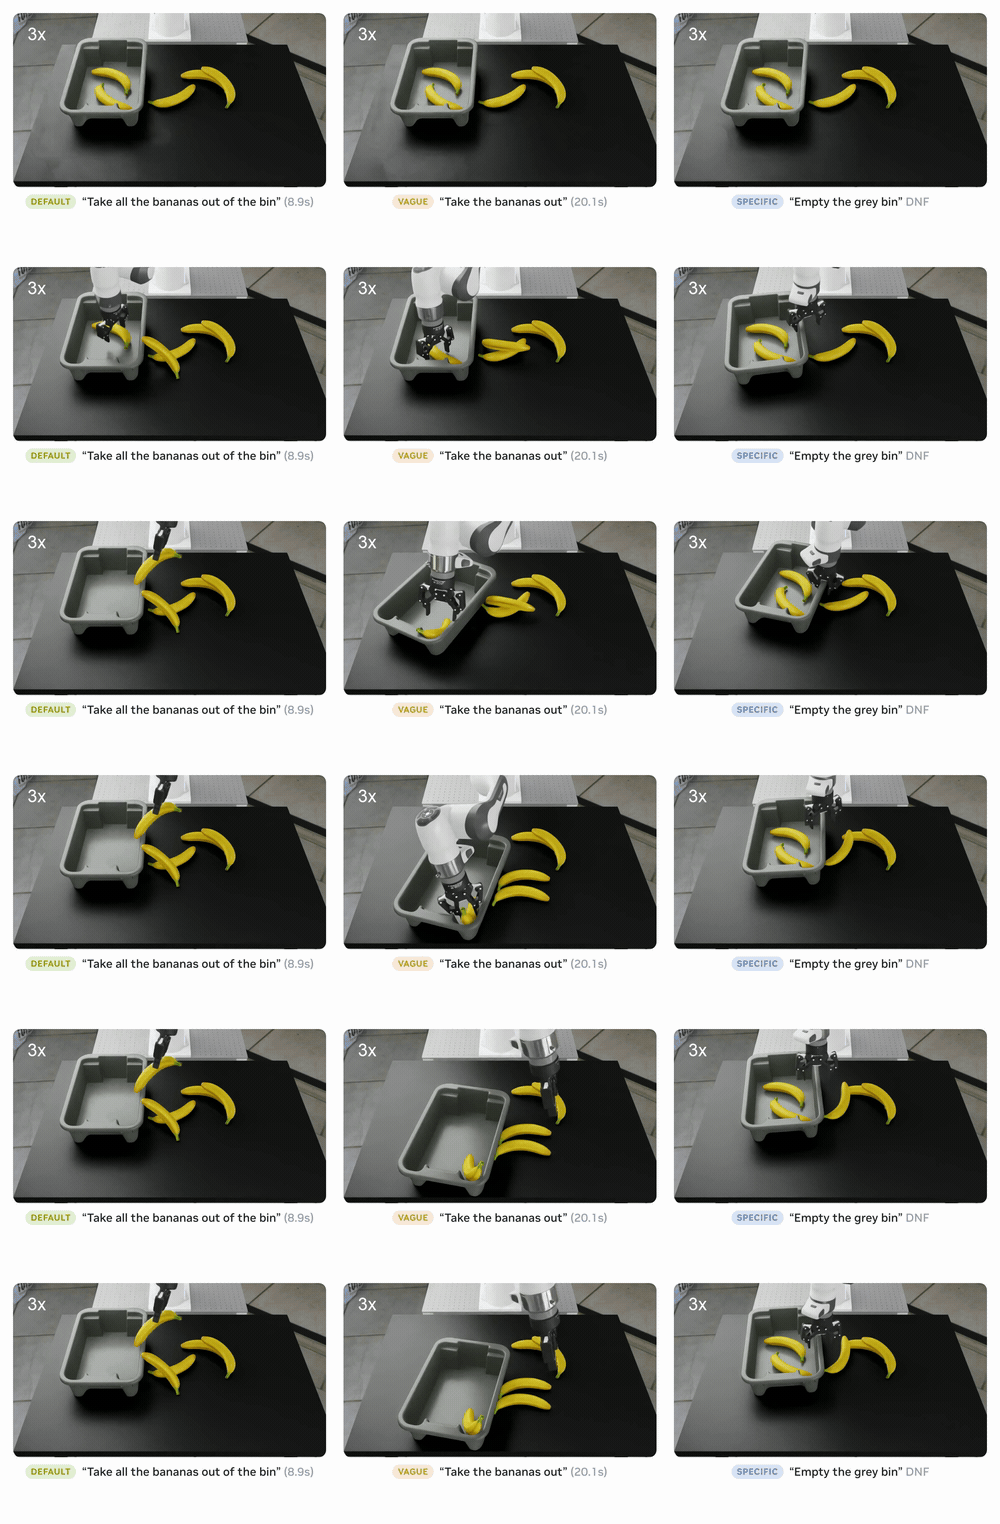
Figure 10. A demonstration of a policy struggling as the language commands get more vague. The task is to remove all three bananas from the bin, but as the instructions get more vague and require more reasoning, the policy fails to understand the intended task goal. | Source: NVIDIA
Scene complexity
Real environments are rarely as tidy as training scenes, often containing distractor objects, clutter, and visual noise that can confuse object identification. Evaluating performance as scene complexity increases shows whether a policy can still isolate the right target amid visual distractors.
Task complexity: short vs. long task horizon
Many real-world tasks aren’t single-step actions but sequences of dependent subtasks, where small failures early on can cascade into complete task failure later. For example, a task such as “Put away mugs in the cabinets” may require opening the cabinet first before grabbing the mug.
Measuring how performance degrades as task horizon grows reveals how well a policy sustains accuracy over extended reasoning chains. Task designers can specify the expected sequence of subtasks in RoboLab tasks and track how well the policy progresses along. We find that most policies struggle with long-horizon tasks, with no policy able to perform more than four complex subtasks successfully.
How sensitive is your robot policy against variations?
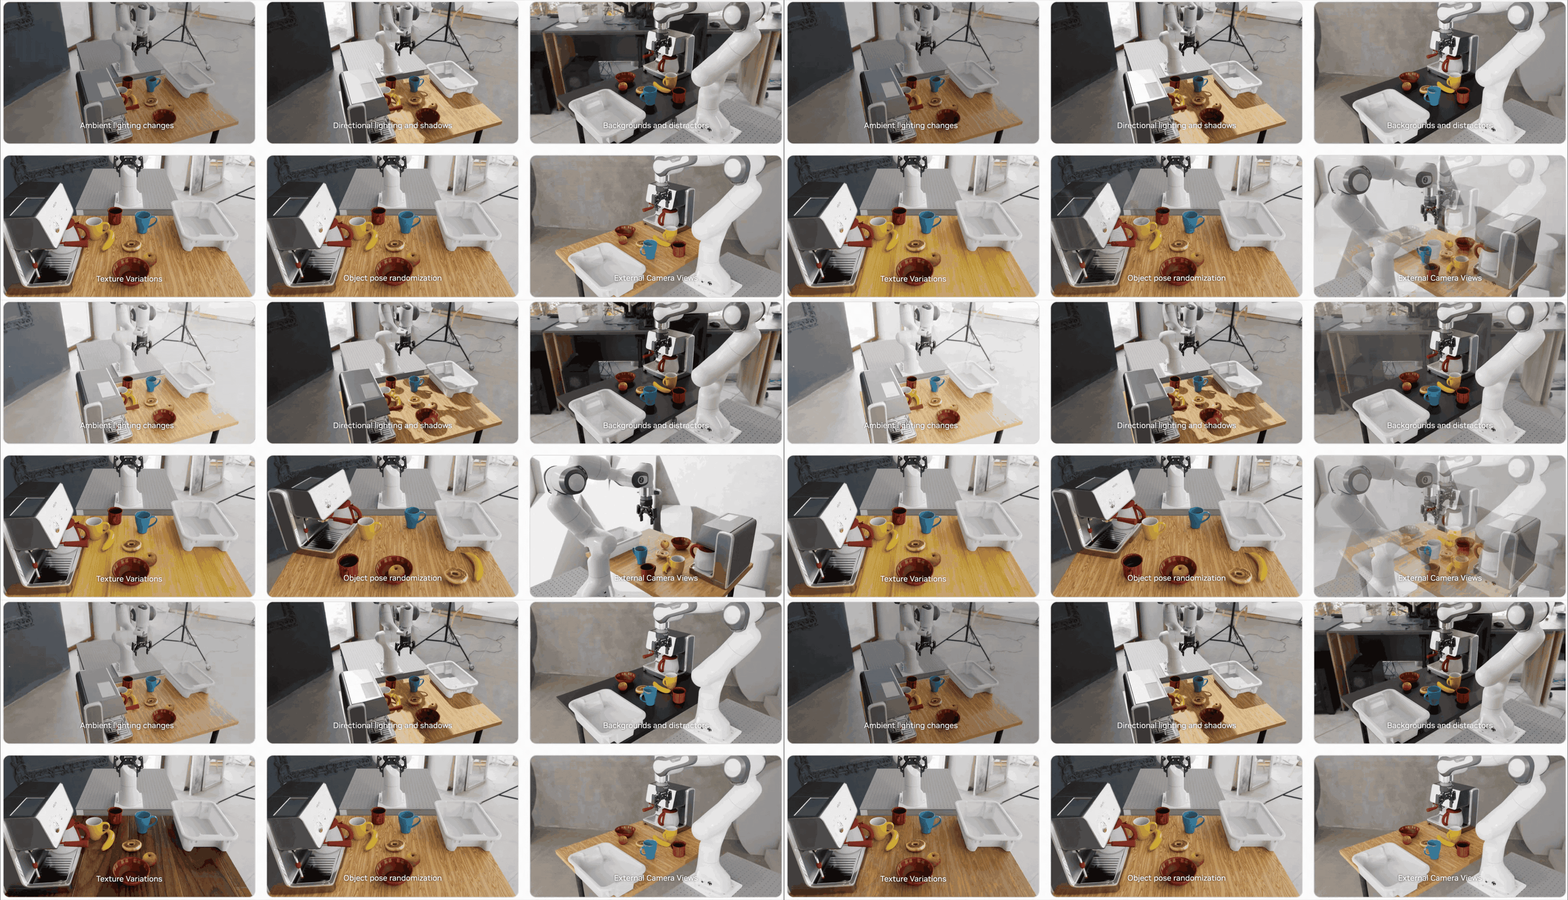
Figure 11. Scene variations that could impact performance. Testing each variation in a single rollout is exponential in the number of experiments. NVIDIA introduced sensitivity analysis, which allows it to pinpoint variables affecting performance without testing in isolation. | Source: NVIDIA
Certain environmental variations can cause performance drops, but at scale, testing each variable in isolation quickly becomes intractable. Instead, we run evaluations across many scene variations simultaneously and apply sensitivity analysis, which identifies which environmental variables are most associated with success or failure, turning intuitions like “camera placement might matter” into quantified findings.
Given episode rollouts under variation 𝜃 with observed outcome 𝑥 — for example, task success — the posterior distribution 𝑝(𝜃 ∣𝑥) ∝𝑝(𝑥 ∣𝜃)𝑝(𝜃) characterizes which conditions 𝜃 are most associated with the outcome 𝑥.
NVIDIA estimated this posterior using Neural Posterior Estimation (NPE), which let the company pinpoint exactly which environmental variable is responsible for a given performance drop, rather than guessing at each factor’s impact one at a time.
Why it matters
Robotics benchmarking still lags far behind the rest of AI research, and without a field-standard benchmarking platform, it is difficult to measure progress. As policies grow more capable, success rates alone won’t tell us whether a model truly generalizes or just memorized its test conditions, and that gap will only widen as models improve.
The path forward requires evaluation that evolves as fast as the models it measures: benchmarks that expand rather than saturate, metrics that diagnose rather than simply score, and analysis that tells researchers not just how well a policy performs, but how to improve it. RoboLab establishes a scalable path toward diagnostic robot evaluation for real-world policies using simulation.
 About the author
 About the author
Xuning Yang is a senior research scientist at NVIDIA’s Seattle Research Lab. Her research interests include robot foundation models, particularly on evaluation methods, and generalization capabilities, as well as a broad range of application scenarios from field robotics, indoor navigation, and robot manipulation. Prior to NVIDIA, she received her Ph.D. in robotics from Carnegie Mellon University.
Editor’s note: This article was syndicated from NVIDIA’s blog.
The post NVIDIA shares how to evaluate general-purpose robot policies for real-world deployment appeared first on The Robot Report.