Over the past decade, multiple forces have converged to push enterprises to rethink how they connect corporate offices around the world. The establishment of SD-WAN as a standard network technology, the replacement of MPLS service with more affordable internet, the migration of apps and data to the cloud, and the changes in security strategies enabled by the SASE framework have created a dynamic, though complex environment in the corporate wide area network (WAN) space. Now, AI might come along and further change how enterprises manage their WAN and how they connect to resources.
When SD-WAN first emerged as a networking technology in the late 2010’s, we and other market observers predicted the decline of expensive MPLS service. According to the results of our WAN Manager Survey in the Cloud and WAN Research Service, this decline has now materialized. Internet has supplanted MPLS service as more enterprises settle on DIA as the underlay option of first choice.
Because DIA will take over much of the lost revenue from MPLS, we focused this market update on global DIA pricing trends. Let’s take a look at the rise of DIA over MPLS, WAN product trends over time, DIA price trends, and DIA prices across time and geographies.
DIA is on the rise, while MPLS is waning
Undoubtedly, internet is the core of the WAN, and it’s now clear that DIA is the most common underlay product. WAN managers reported that an average 53.88% of their sites were connected with DIA—the most common option among respondents. Enterprises prefer DIA for the carrier-grade SLAs and good backbone connectivity to avoid middle mile issues.
At 22% of sites on average, MPLS use is waning among WAN managers and is dwarfed by rising DIA implementation. While 74% of respondents use MPLS at any site, 96% of respondents reported employing DIA.
WAN product trends over time
Since we have been asking about product usage on a per-site basis since 2018, we can identify trends around how product use has changed in this period.
Product mix changes over time (2018-2025)
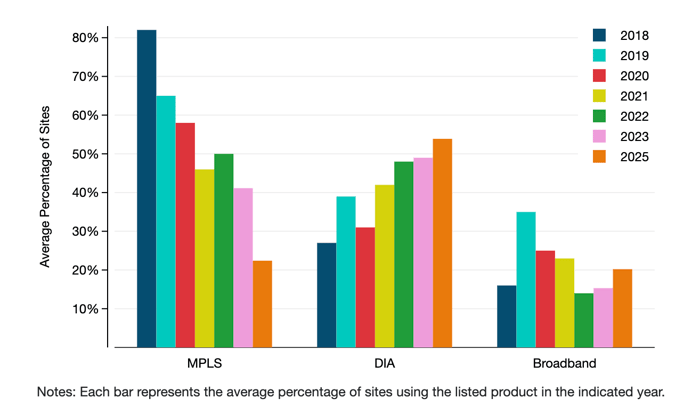
The most glaring change from 2018 to 2025? The decline of MPLS. When we began the WAN Manager Survey in 2018, MPLS comprised an average of 82% of sites, but was down to 22% by late 2025. While it’s not likely that MPLS will entirely disappear, it is likely to have niche applications going forward.
On the other hand, DIA picked up much of the MPLS slack, growing from 27% to 54% of sites. Broadband has been more up and down. Enterprises might have experimented with it early in the SD-WAN days and switched to DIA instead, but it is back to growth in the latest update.
DIA price trends
Since DIA is becoming the cornerstone of WAN revenue, this update takes a deep dive on global DIA pricing trends, looking at how prices vary by geography, port size, and over time. Before we get into all things DIA, let’s get one myth out of the way. We have heard carriers and customers argue for years that MPLS prices will fall in line with DIA since carriers have a sunk cost in MPLS infrastructure and don’t want to lose that revenue. MPLS demand is falling both due to price but also because of the greater efficiency of local breakouts for cloud services and modern WAN traffic patterns. It would make some sense for carriers to drop MPLS prices to bolster demand. We just don’t see it in the data though. Perhaps the greater overhead costs of running MPLS just can’t allow for a pricing floor close to that of DIA.
GigE DIA and Best Efforts MPLS in Key Global Markets (Q1 2026)
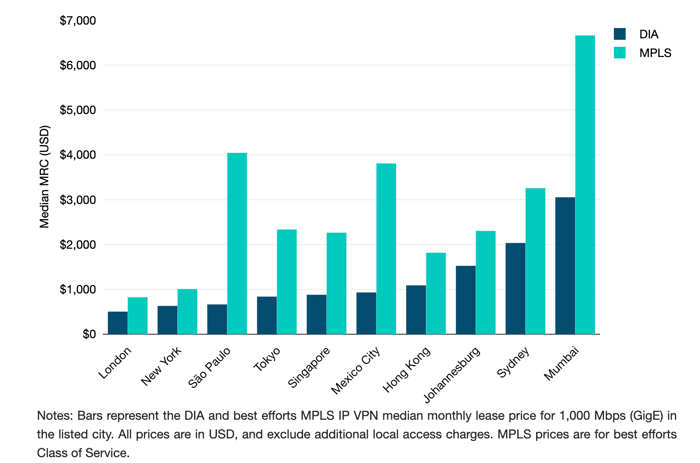
In all 10 of these key global markets, MPLS is 50% to 500% more expensive than DIA. While the median MPLS price is only about 1.5 times DIA in markets like Johannesburg and Hong Kong, it can be 4 to 6 times more expensive in markets like Mexico City and São Paulo.
How DIA prices have changed over time
While DIA prices vary considerably around the world, they are also dynamic, changing significantly over time. While there are a few exceptions, after tracking prices for more than two decades we can say that network connectivity prices almost always fall. How much they are likely to fall often depends on 1) geography, 2) port size, and 3) individual carrier strategy.
Broadly speaking, more developed, less expensive regions are likely to experience the most modest price declines. If the absolute price is already low, the percentage decline is likely to be as well—otherwise prices soon approach costs (which is sometimes an issue in the industry). More expensive regions will often attract new infrastructure development, where higher prices can justify new investment—but then prices fall due to the additional supply. We have restricted our price time series analysis to the cities we used for each subregion in the geographic analysis above. This keeps us from seeing noise in the data from cities for which we get little or inconsistent data.
Average CAGRs Across Subregions for FastE and GigE DIA (Q1 2023-Q1 2026)
Decreasing CAGR
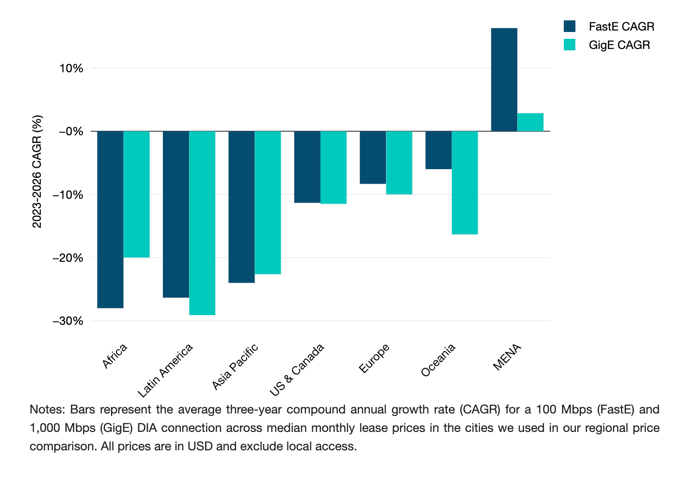
Sub-Saharan African and Latin American cities tended to fall the fastest, at between 20% and 30% annually from Q1 2023 to Q1 2026.
While the APAC region as a whole has a higher average CAGR this is concentrated in expensive markets like Bangkok, Hanoi, Kuala Lumpur, and Manila. Cheaper cities like Hong Kong, Singapore, and Tokyo saw relatively small price declines.
Increasing CAGR
MENA is the obvious exception here with both FastE and GigE prices going up on average. Already an expensive region, these price adjustments are due in part to the thin data and its vulnerability to adding or losing a provider, and possibly due to additional geopolitical issues that have arisen in the region in recent years. The Red Sea is one of the largest transport bottlenecks in the world, and while many projects have been announced to alleviate some of the congestion, many of them have been delayed or even cancelled.
Get more WAN intelligence
Whether you’re looking for more data that will help you manage your network or need to brush up on the connectivity landscape, TeleGeography has you covered. Our Cloud and WAN Research Service is the telecom industry’s most comprehensive source for data, analysis, and forecasts on international cloud connectivity and WAN services, and global WAN market size. Learn more about Cloud and WAN Research Service.
You can also take a look at our Network Pricing Database—and specifically the DIA Pricing and MPLS VPN Pricing modules. Subscribe to all pricing modules in the suite, or choose the modules you need.