Organizations running machine learning (ML), analytics, and generative AI workloads on Amazon SageMaker Unified Studio domains and projects face a common cost governance challenge. System tags (AmazonDataZoneDomainId and AmazonDataZoneProject) are automatically propagated to all underlying project resources. However, custom tags such as CostCenter, Team, or Environment are not propagated to dynamic resources created through the Studio UI. This creates a gap when you need to report project costs grouped by custom tags.
In this post, we walk through a serverless solution that bridges this gap by enriching AWS Cost and Usage Report (CUR) data with custom project tags. By the end of this post, you can build an Amazon Quick Sight dashboard to filter and analyze Amazon SageMaker Unified Studio project costs by any custom tag dimension that you define. This gives your team the visibility to make informed spending decisions.
Solution overview
The solution consists of three automated subsystems:
- Event-driven tag lookup management – An Amazon EventBridge rule captures Amazon DataZone project lifecycle events (Create, Update, Delete) and triggers an AWS Lambda function. The function maintains an Amazon DynamoDB lookup table that maps each project’s DomainId and ProjectId to its custom tags.
- CUR enrichment pipeline – An AWS Glue extract, transform, and load (ETL) job reads CUR 2.0 Parquet data from Amazon Simple Storage Service (Amazon S3). The job joins each billing line item with the DynamoDB lookup table using the system tags (DomainId, ProjectId), appends the custom tag values as new columns, and writes the enriched data back to Amazon S3.
- Cost visualization – An Amazon Quick Sight dashboard backed by a custom SQL dataset over Amazon Athena provides interactive cost and consumption analytics filtered by custom tags.
Architecture
The following diagram shows the end-to-end architecture:
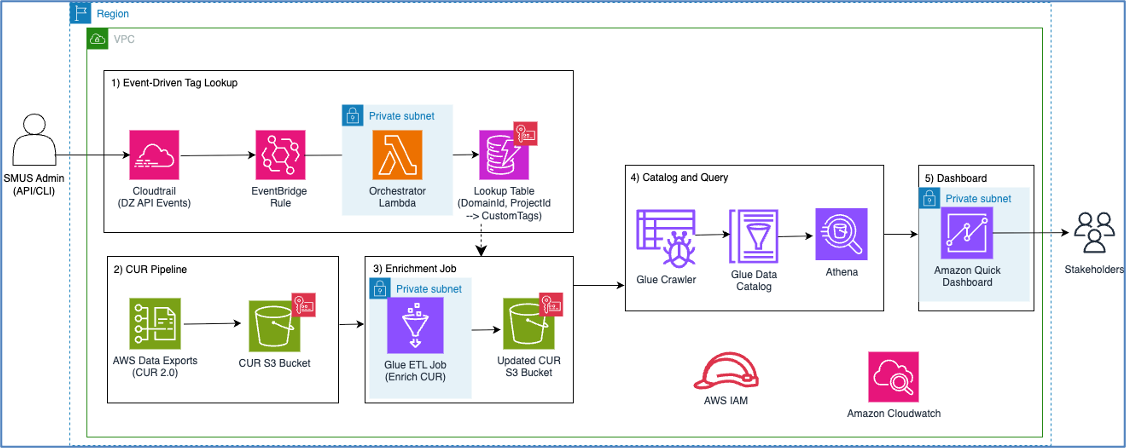
Figure 1: SageMaker Unified Studio project custom tag cost reporting
The workflow is as follows:
- An Amazon SageMaker Unified Studio administrator creates or updates a project with custom tags.
- AWS CloudTrail captures the API call.
- Amazon EventBridge matches the event.
- The Lambda orchestrator writes the tag mapping to DynamoDB.
- Separately, AWS Data Exports delivers CUR data to Amazon S3.
- The AWS Glue ETL job enriches CUR line items with custom tags from DynamoDB.
- The AWS Glue Crawler catalogs the enriched data.
- Amazon Quick Sight visualizes costs by custom tags.
Prerequisites
Before deploying this solution, you need:
- An Amazon SageMaker Unified Studio domain (you create projects after deployment).
- AWS Cloud Development Kit (AWS CDK) CLI installed.
- Python 3.12+.
- Amazon Quick Sight Enterprise edition enabled in your account.
- An AWS Identity and Access Management (IAM) user or role with permissions to deploy AWS CloudFormation stacks.
You configure custom tags on project profiles through the Amazon DataZone API. First, enable custom tags on your project profile:
When creating or updating a project, set the tag values:
Important: The AmazonSageMakerProvisioning-<domainAccountId> role needs an inline policy that permits your custom tag keys. Without this, project environment deployment fails.
The following is the inline policy that’s used for the custom tags shared in this post:
Activate the SageMaker Unified Studio system tags as cost allocation tags so they appear in CUR data:
These tags take up to 24 hours to start appearing in CUR reports after activation.
Step 3: Deploy the infrastructure
The solution is packaged as a CDK application. Clone the GitHub repository and deploy:
This creates the following resources:
- DynamoDB table (smus-project-tag-lookup) – stores project-to-tag mappings.
- Lambda function (smus-orchestrator) – processes project lifecycle events.
- Amazon EventBridge rule – matches Amazon DataZone
CreateProject/UpdateProject/DeleteProjectevents. - S3 buckets – for raw CUR and enriched CUR data.
- AWS Glue ETL job (smus-cur-enrichment) – enriches CUR with custom tags.
- AWS Glue Crawler – catalogs enriched data.
- Amazon Simple Notification Service (Amazon SNS) topic – pipeline failure alerts.
Note: The solution uses serverless components (Lambda, DynamoDB on-demand, AWS Glue, Amazon Quick Sight), so you only pay for what you use. The primary cost drivers are AWS Glue ETL job execution time and Amazon Quick Sight SPICE storage.
Step 4: Configure CUR delivery
Create a CUR 2.0 export through AWS Data Exports that delivers Parquet files to the CUR S3 bucket created by the stack. The following screenshots show the complete configuration process in the AWS Billing and Cost Management console.
To create the export, follow these steps:
- Go to AWS Billing and Cost Management and then choose Data Exports.
- Choose Create in the upper right corner of the Exports and dashboards page. The Data Exports console shows any existing exports, their status, export type, data table, and last refresh date.
- On the Create export page, under Export details, select Standard data export and enter an export name. Under Data table content settings, select CUR 2.0.
- Under Data table configurations, set Time granularity to Hourly. The configuration page also lets you choose additional export content options such as including resource IDs, split cost allocation data, caller identity allocation data, and capacity reservation columns.
- Under Data export delivery options, set Compression type and file format to Parquet. Under Data export storage settings, configure the S3 bucket to: smus-cur-report-{account-id}-{region} and set the S3 path prefix as needed. Choose Create to finish.
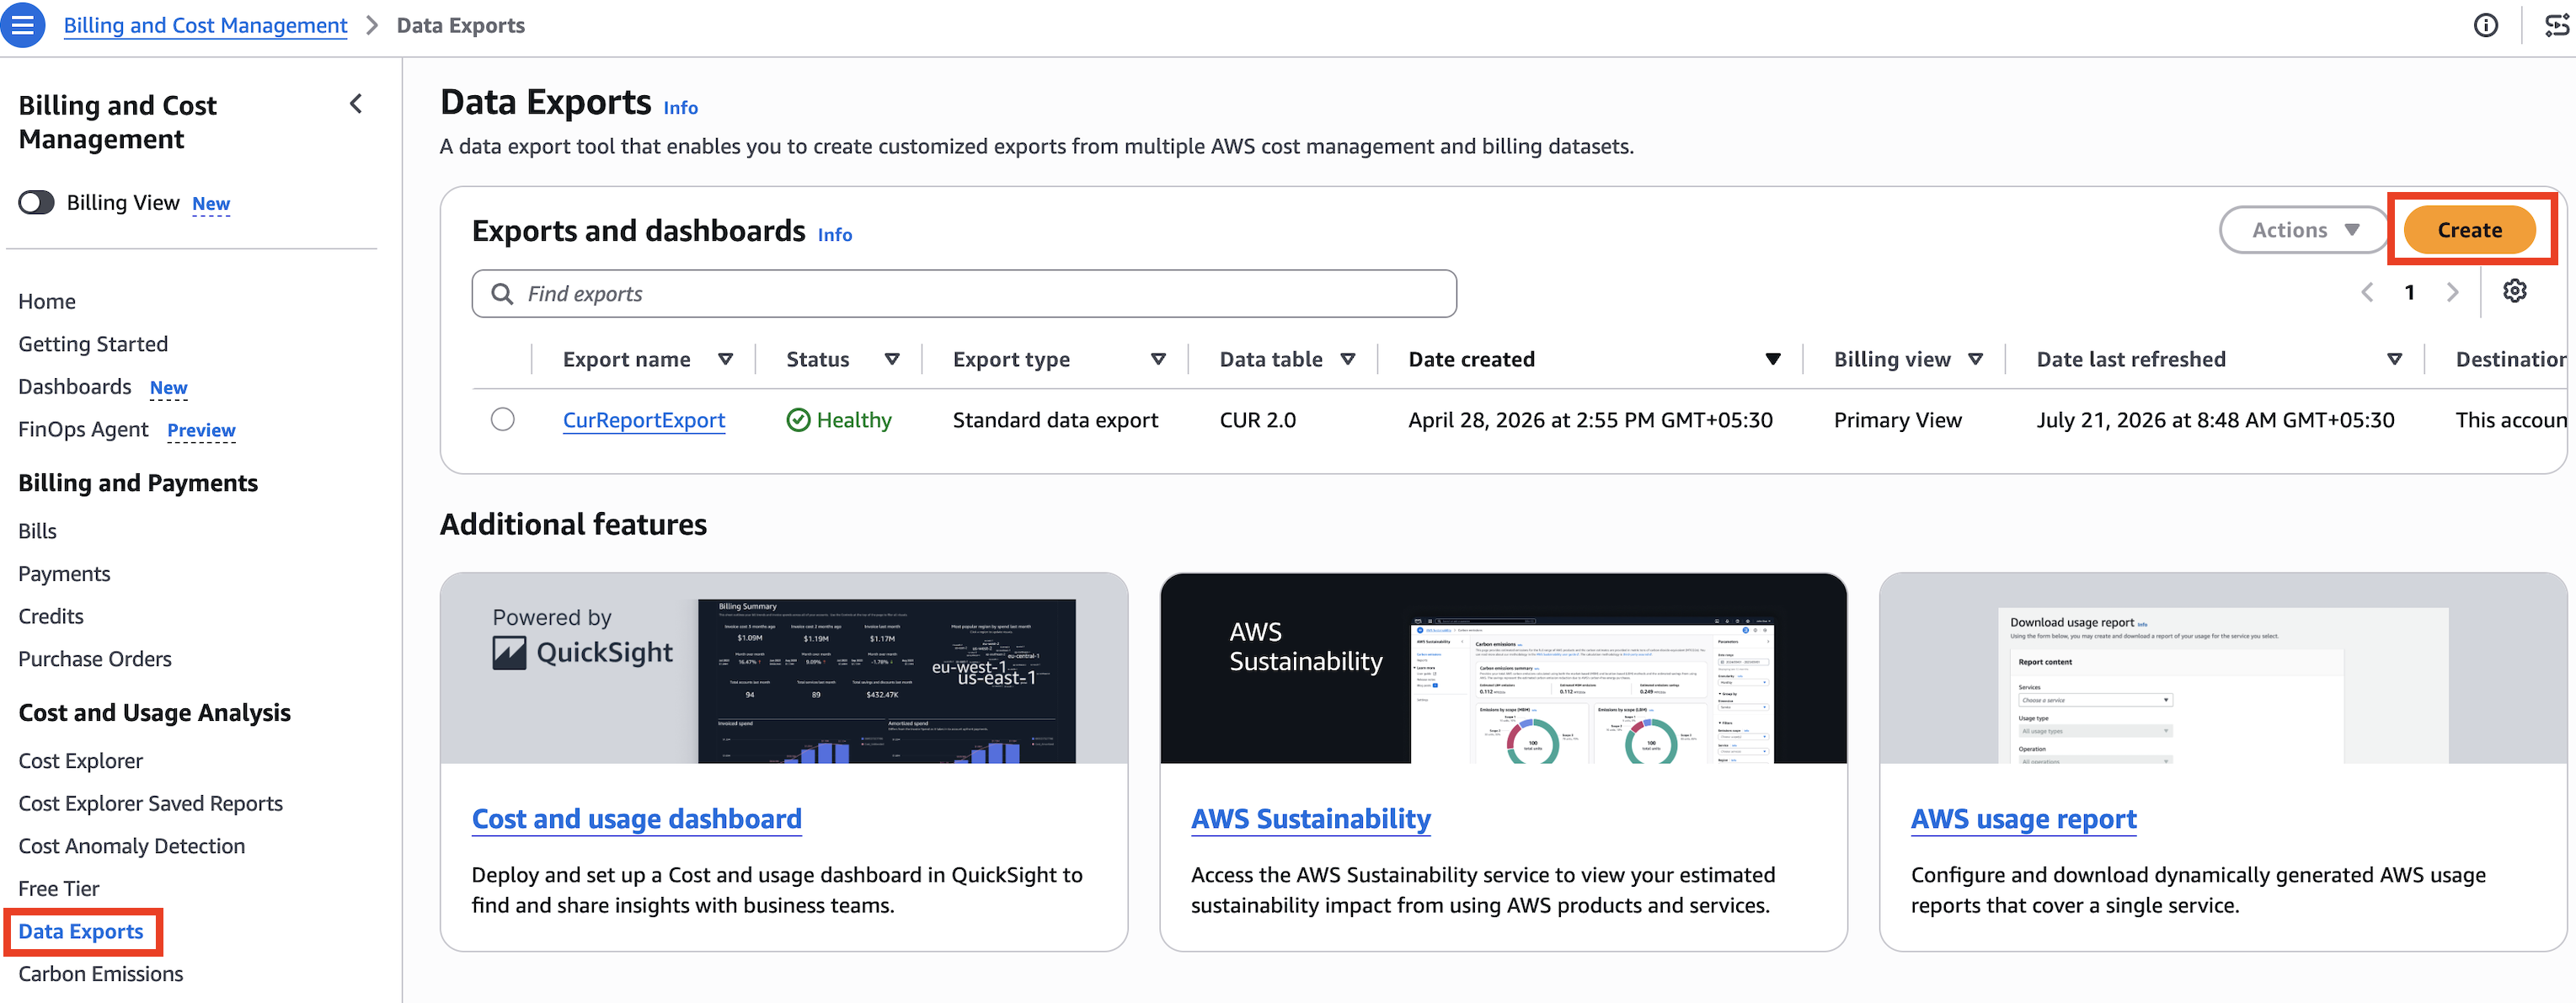
Figure 2: Data Exports page listing existing exports
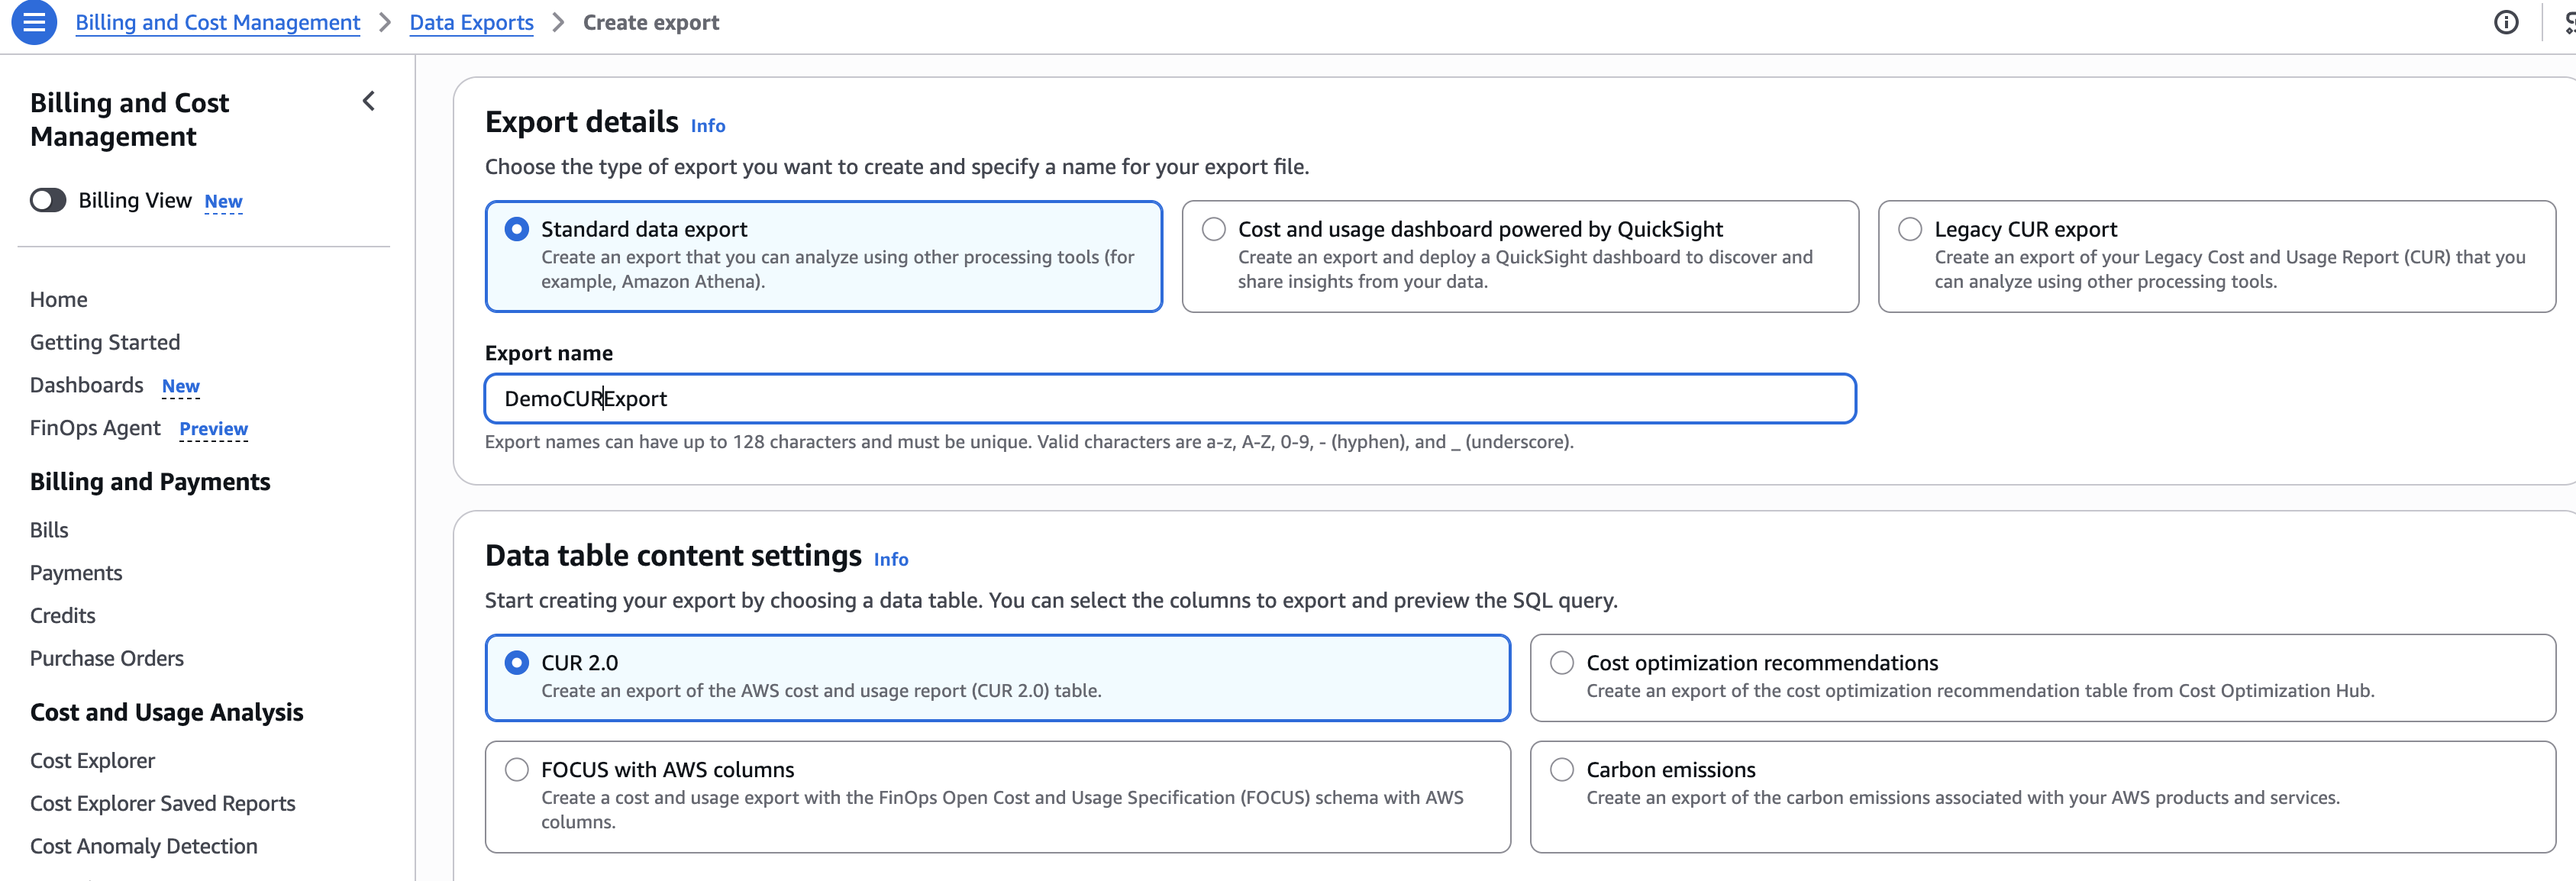
Figure 3: Create export page with Standard data export and CUR 2.0 selected
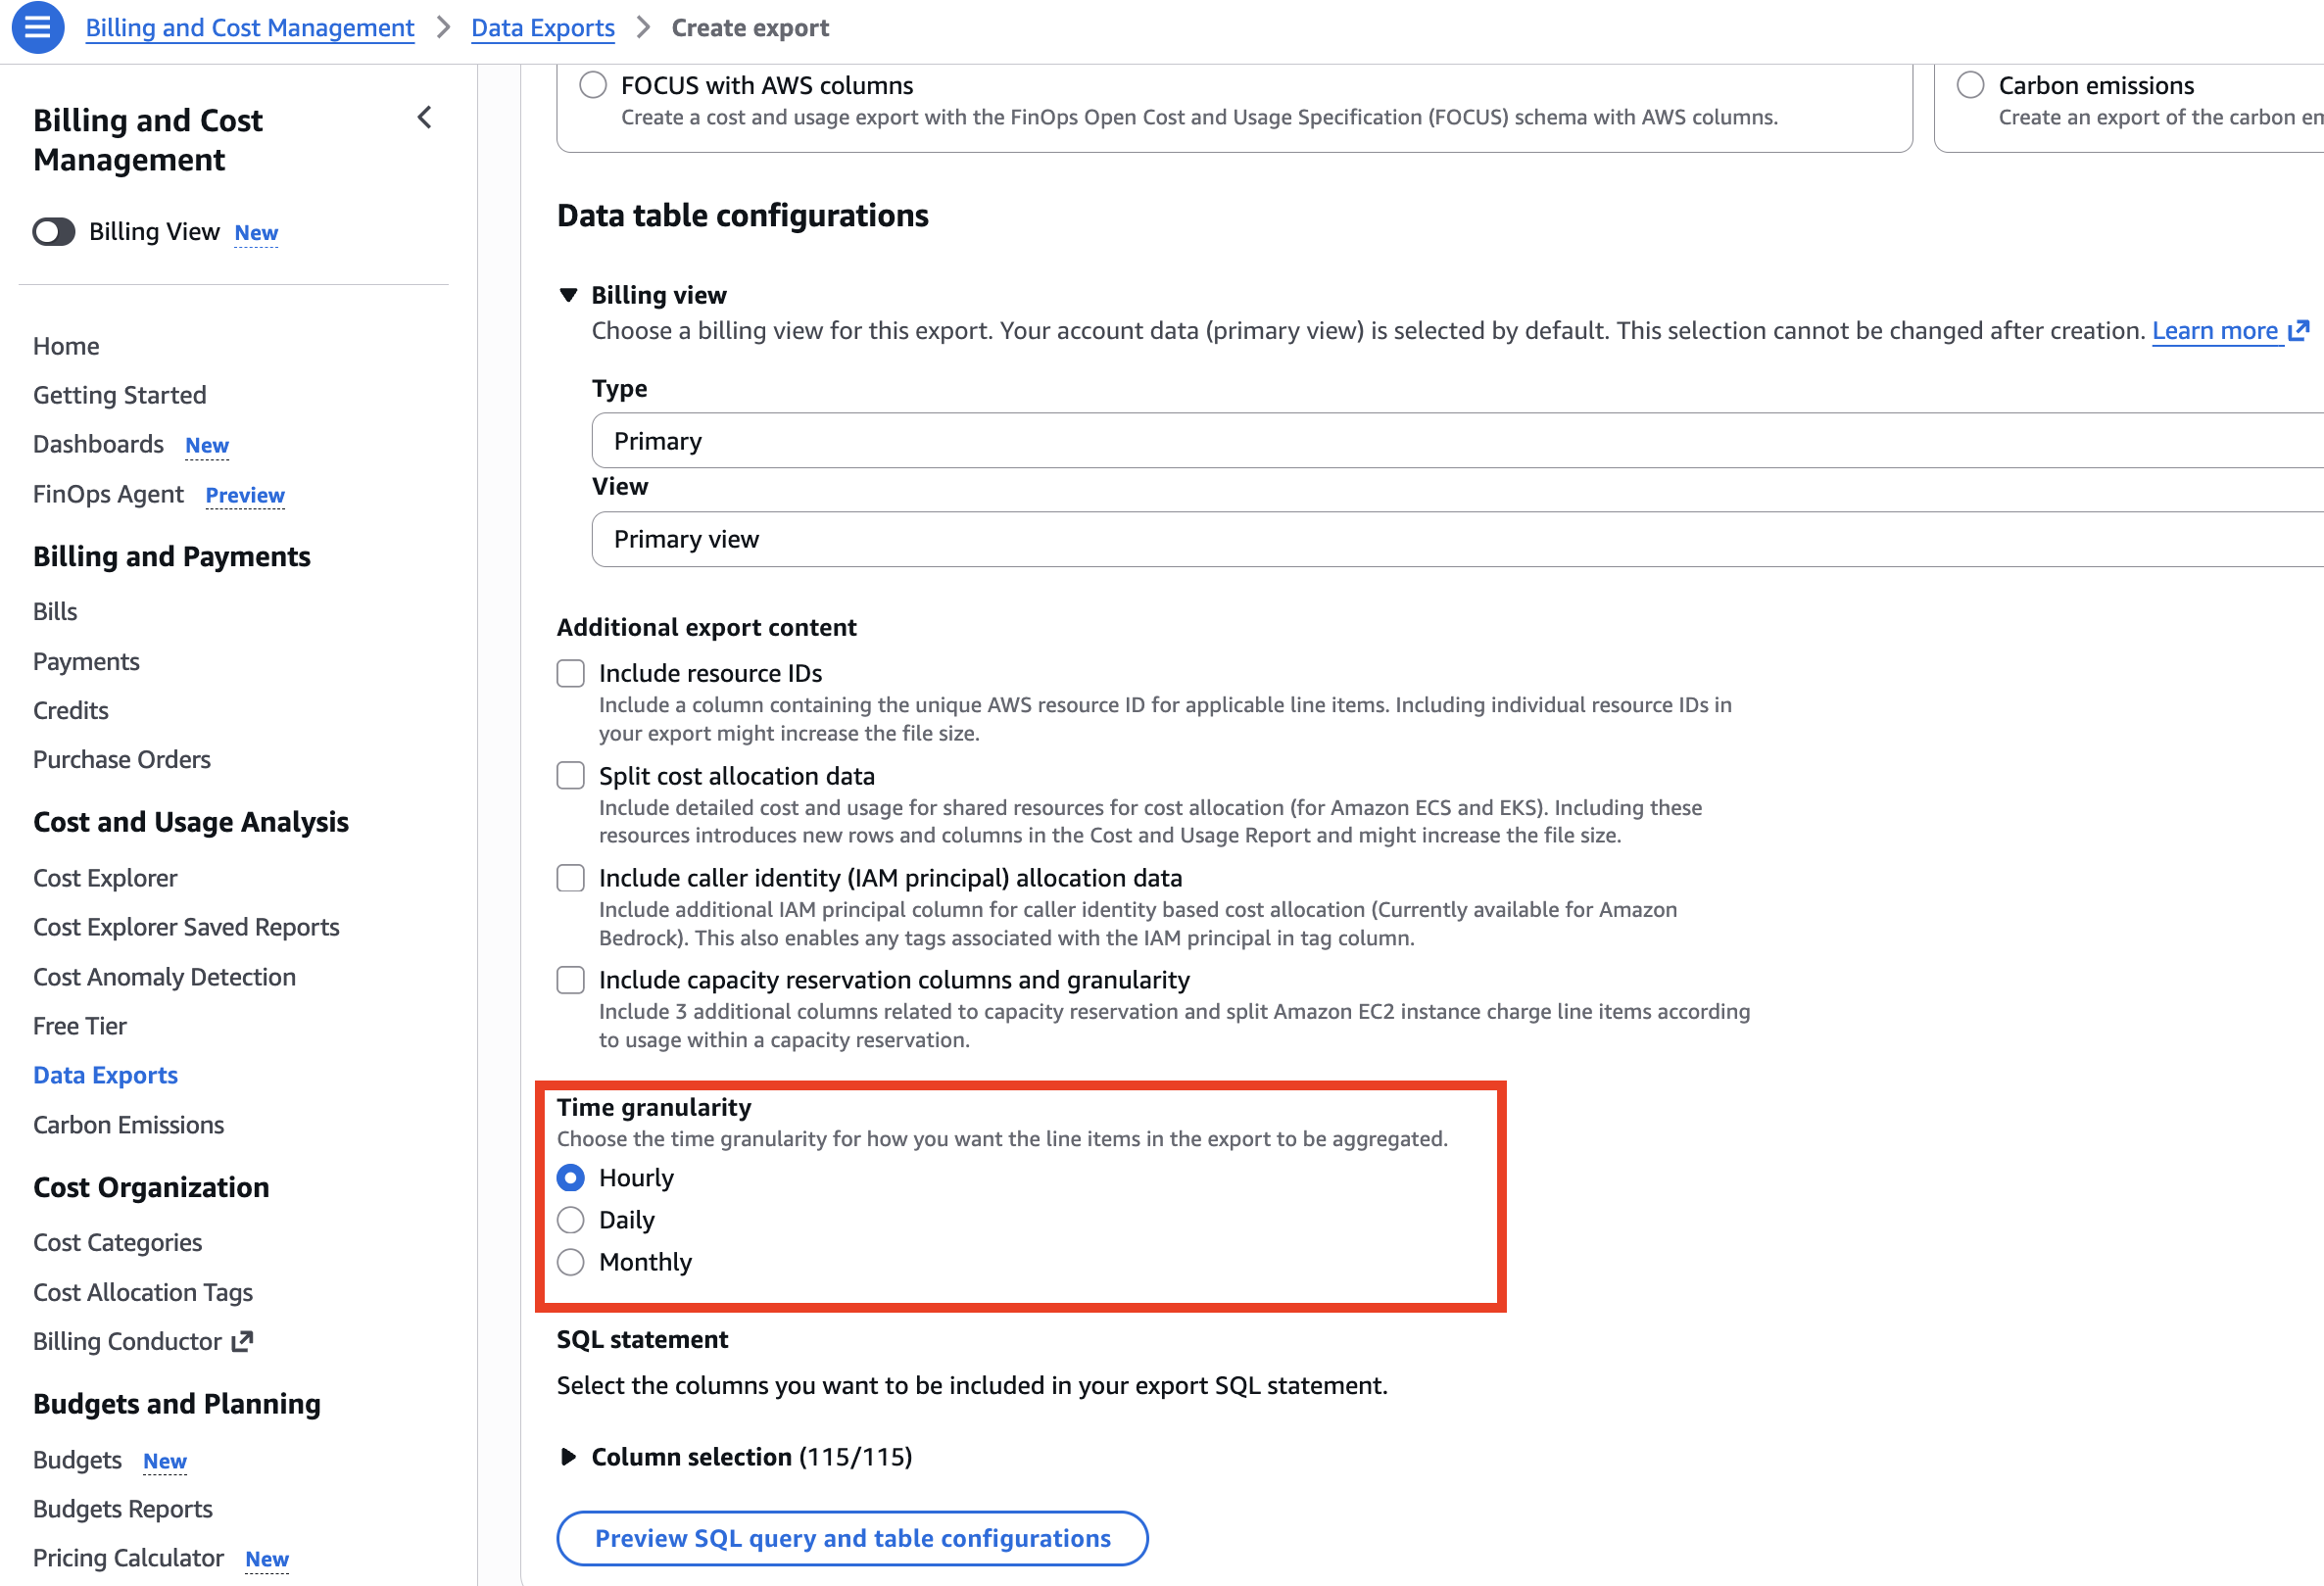
Figure 4: Data table configurations with time granularity set to Hourly
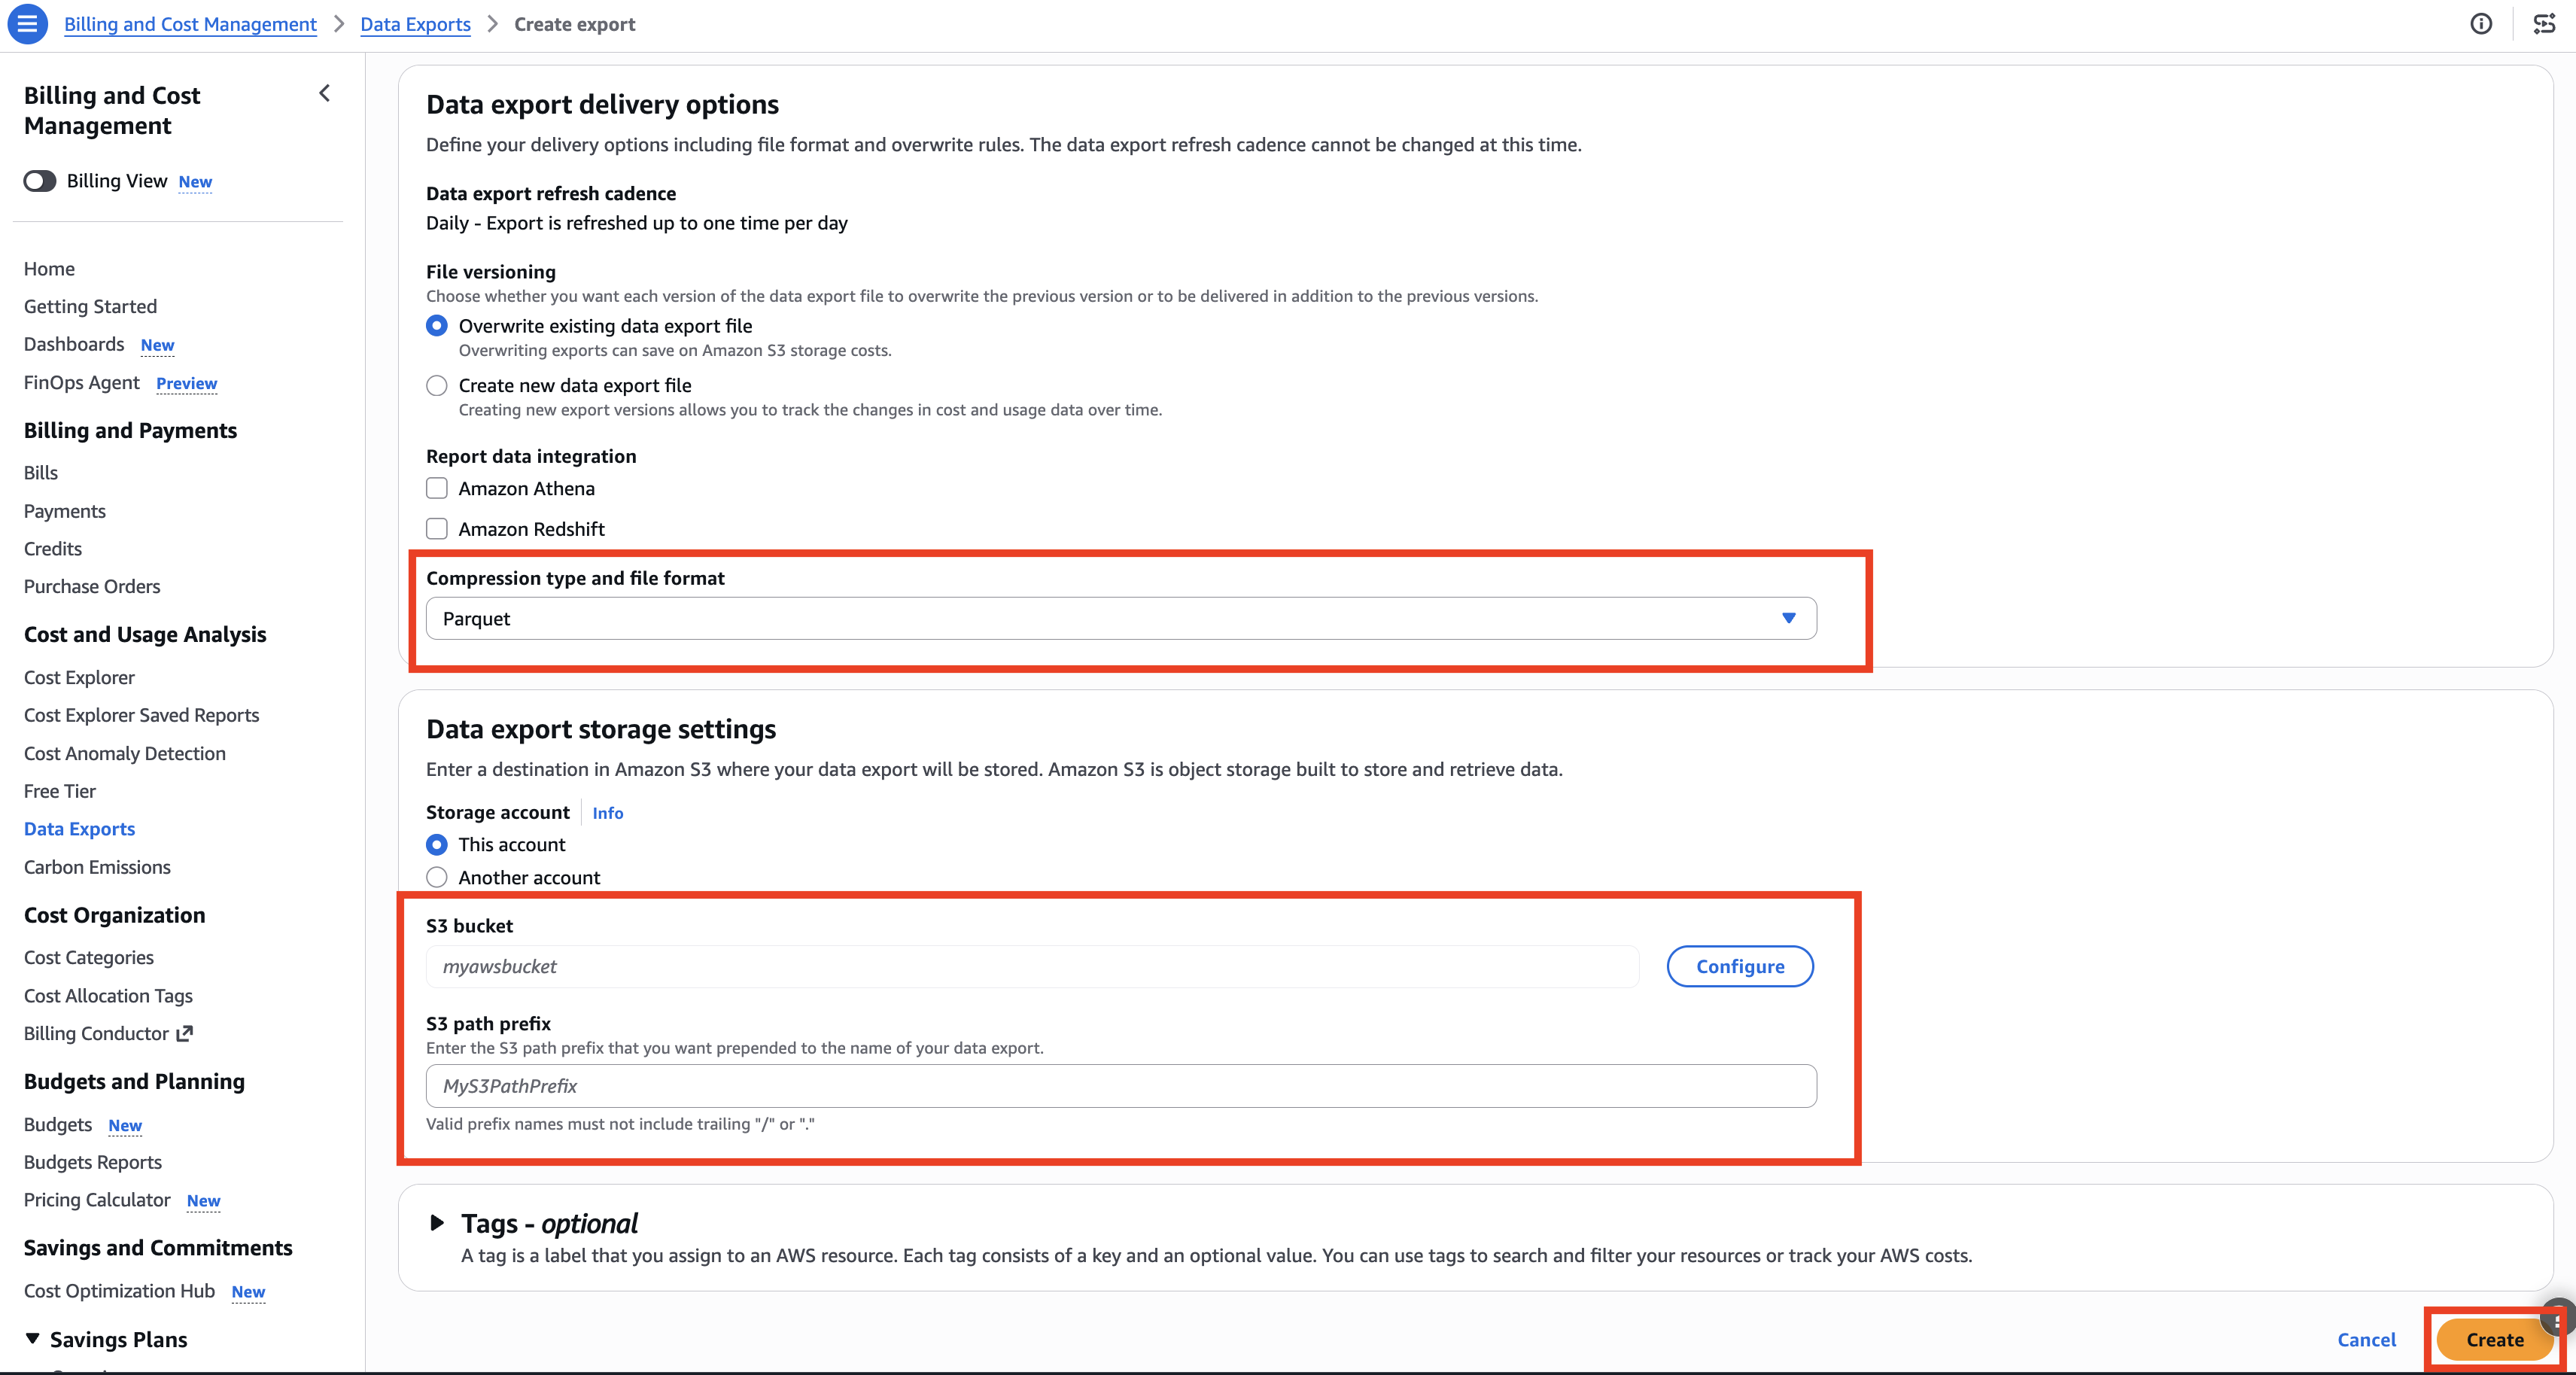
Figure 5: Data export delivery options with Parquet format and S3 storage settings
Step 5: How the event-driven tag capture works
When a project is created or updated in Amazon SageMaker Unified Studio (through the Studio UI or API), the following happens automatically:
- CloudTrail logs the Amazon DataZone API call.
- Amazon EventBridge matches the event.
- Amazon EventBridge invokes the Lambda function.
- The Lambda extracts custom tags from the CloudTrail event payload.
- The Lambda writes a record to DynamoDB with the DomainId, ProjectId, and all custom tag key-value pairs.
The Lambda function reads tags directly from the responseElements.resourceTags field of the CloudTrail event rather than making a separate GetProject API call. This avoids a race condition where GetProject might return empty tags while the project is in the UPDATING state.
Step 6: How the CUR enrichment works
The AWS Glue ETL job runs on a schedule (after each CUR delivery):
- Reads CUR Parquet files from the CUR S3 bucket.
- Reads all records from the DynamoDB lookup table.
- Performs a left outer join on DomainId and ProjectId.
- Appends custom tag columns (CostCenter, Team, Environment, and so on) to each CUR line item.
- Writes enriched Parquet to the enriched S3 bucket.
Line items without a matching project in the lookup table retain all original columns with NULL custom tag values. No data is dropped.
Step 7: Set up the Amazon Quick Sight dashboard
After the first ETL run and crawler execution, set up the Amazon Quick Sight dashboard:
This creates a dashboard with five visuals:
- Cost by Custom Tag (CostCenter) – horizontal bar chart.
- Cost by Project – horizontal bar chart.
- Daily Cost Trend – line chart.
- Cost by Service per Project – stacked bar chart.
- Usage by Project & Service – summary table.
And six interactive list filters: Domain, Project, CostCenter, Team, Environment, Service.
The custom SQL includes a CASE statement for service categorization:
Step 8: Verifying the solution
After deploying the infrastructure and setting up the dashboard, verify that each component of the pipeline is functioning correctly.
8.1 Verify Amazon EventBridge is capturing project events
- Open the Amazon EventBridge console.
- In the navigation pane, choose Rules.
- Select the rule created by the CDK stack (for example,
SmusCostReporting-ProjectTagRule). - Choose the Monitoring tab.
- Confirm that the invocations are being recorded in the metrics.
- Create or update an Amazon SageMaker Unified Studio project with custom tags using the following command:
- Within a few seconds, the Amazon EventBridge rule should show a new invocation in its metrics.
8.2 Verify DynamoDB schema and tag mappings
The DynamoDB lookup table uses a simple key schema:
| Attribute | Type | Role |
| domainId | String | Partition Key |
| projectId | String | Sort Key |
| CostCenter | String | Custom tag |
| Team | String | Custom tag |
| Environment | String | Custom tag |
Custom tags are stored as dynamic attributes. Any tag key set on a project becomes a column in the table.
8.2.1 Verify DynamoDB table contains tag mappings
- Open the DynamoDB console.
- Navigate to the table created by the stack (for example,
SmusCostReporting-ProjectTagsTable). - Choose Explore table items.
- Scan for your project with the following keys:
- Confirm the item contains the expected custom tag attributes (CostCenter, Team, Environment) with the values you assigned.
- Alternatively, use the AWS CLI:
8.3 Verify the AWS Glue ETL job enriches CUR data
- Wait for the next CUR delivery (hourly if configured as described in Step 4).
- Wait for the subsequent AWS Glue job execution.
- Open the AWS Glue console.
- In the navigation pane, choose ETL Jobs.
- Confirm the job completed successfully (status: Succeeded).
- Query the enriched data in Amazon Athena to confirm custom tag columns are populated:
You should see rows with your custom tag values populated in the costcenter, team, and environment columns.
8.4 Verify the Amazon Quick Sight dashboard displays enriched data
- Open the Amazon Quick Sight console and navigate to the dashboard created by the setup script.
- Confirm that:
- The Cost by Custom Tag (CostCenter) bar chart displays cost data grouped by your CostCenter values.
- The list filters for CostCenter, Team, and Environment contain selectable values.
- Selecting a filter value correctly narrows the displayed data.
- If the dashboard shows no data, verify that:
- The AWS Glue Crawler has run after the ETL job (check the crawler’s last run status in the AWS Glue console).
- The SPICE dataset has been refreshed. In the Amazon Quick Sight console, navigate to Datasets, select the dataset, and then choose Refresh now.
Figure 6 shows the Amazon Quick Sight dashboard with two side-by-side horizontal bar charts: Cost by Cost Center and Cost by Project. Domain Name and Project Name list filters appear at the top.
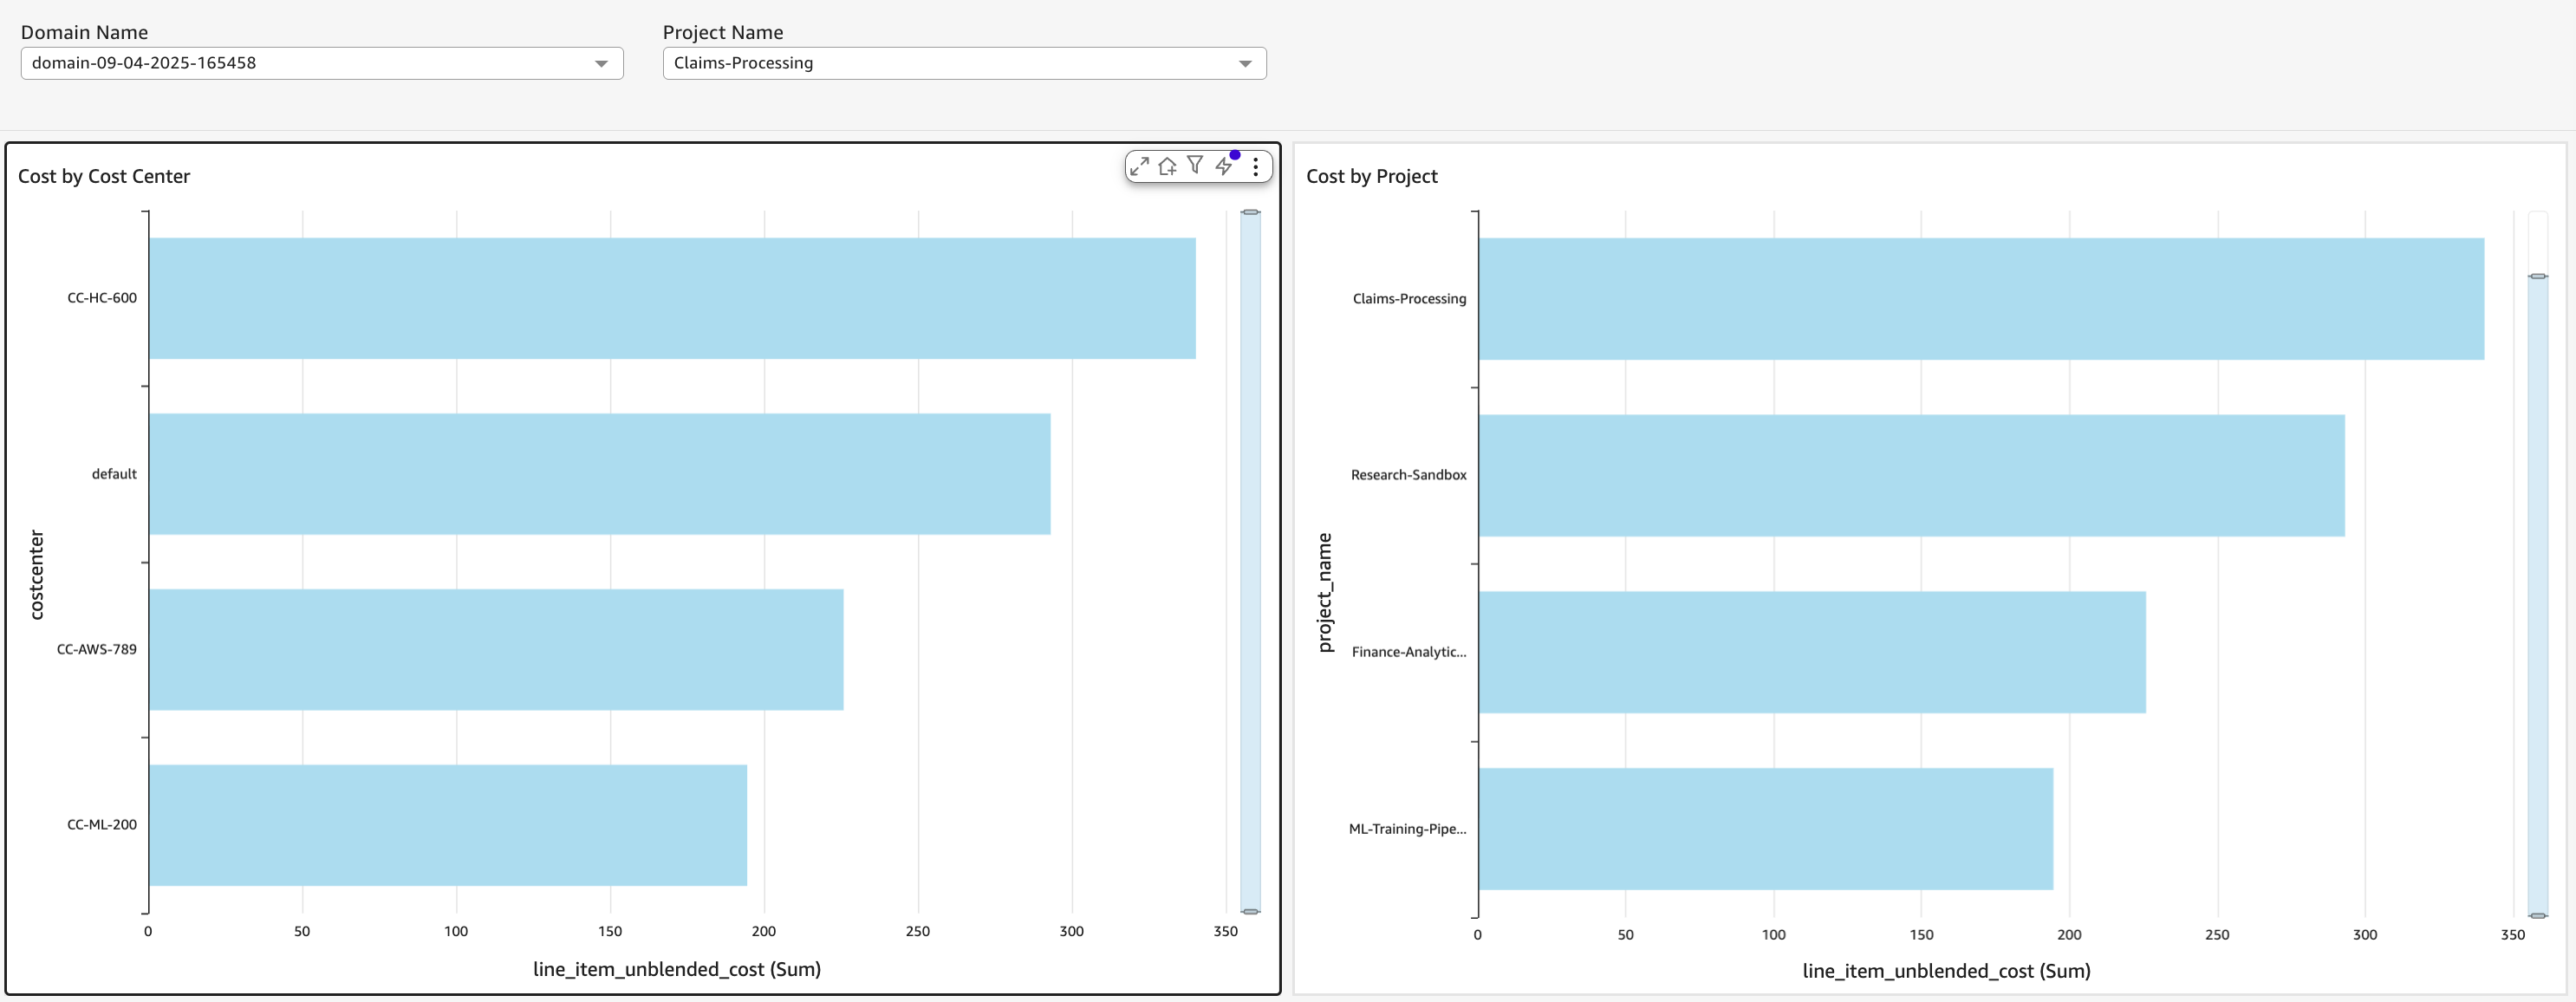
Figure 6: Amazon Quick Sight dashboard showing cost data by custom tags, including Cost by Cost Center and Cost by Project bar charts with Domain Name and Project Name filters
Note: The first end-to-end cycle can take up to 48 hours depending on CUR delivery timing. After the initial cycle completes, subsequent updates will flow automatically on the configured schedule.
Operational considerations
Monitoring: The Amazon SNS topic smus-cost-reporting-alerts receives notifications when the AWS Glue ETL job fails or the Lambda orchestrator encounters repeated errors. Subscribe an email address or Slack webhook to stay informed. For instructions on how to create a subscription, see Subscribing to an Amazon SNS topic.
Cost: The solution uses serverless components (Lambda, DynamoDB on-demand, AWS Glue, Amazon Quick Sight, SPICE) so you only pay for what you use. The primary cost drivers are AWS Glue ETL job execution time and Amazon Quick Sight SPICE storage.
Scaling: The DynamoDB table uses on-demand capacity and can scale to accommodate your projects. You can scale the AWS Glue ETL job by increasing the number of workers for larger CUR datasets. For more information, see Managing throughput capacity automatically with DynamoDB auto scaling.
New tag keys: When you add new custom tag keys to projects, the ETL automatically picks them up as new columns. The AWS Glue Crawler’s UPDATE_IN_DATABASE policy adds new columns to the catalog table without manual intervention.
Cleanup
Warning: The following cleanup steps will permanently delete all CUR data, project tag mappings, and Amazon Quick Sight dashboards.
To remove all resources:
Go to AWS Billing and Cost Management, and then choose Data Exports and delete the CUR 2.0 export created in Step 4.
Deactivate the cost allocation tags that were activated in Step 2:
Conclusion
In this post, we showed how to build an end-to-end cost reporting solution for Amazon SageMaker Unified Studio projects using custom tags. This solution combines tag capture driven by Amazon EventBridge, CUR enrichment through AWS Glue ETL, and visualization in Amazon Quick Sight. With it, organizations can track and attribute costs by CostCenter, Team, Environment, or any custom dimension. This works even for resources created through the Studio UI that don’t receive custom tag propagation.
This solution serves as an extension to the custom tag propagation feature and reports cost for all project resources. The architecture is fully serverless, automated, and can be deployed to any AWS account using the provided CDK application.
To start building your custom tag cost reporting pipeline, visit the GitHub repository. To learn more about the underlying services, visit the Amazon SageMaker Unified Studio service page. For a related approach to custom tag governance, see Use Amazon SageMaker custom tags for project resource governance and cost tracking
References
About the authors